
Figures & data
Table 1 Prevalence of Sensitive Skin by Questionnaire and Response to LAST
Figure 1 Results of questionnaire and LAST scores in healthy skin (HS) and sensitive skin (SS) subjects. (A) Frequency distribution of questionnaire items of HS group (upper) and SS group (lower). The values are expressed as percentage. (B) LAST scores of HS group and SS group. The values are expressed as mean ±SD on a 0–3 scale.
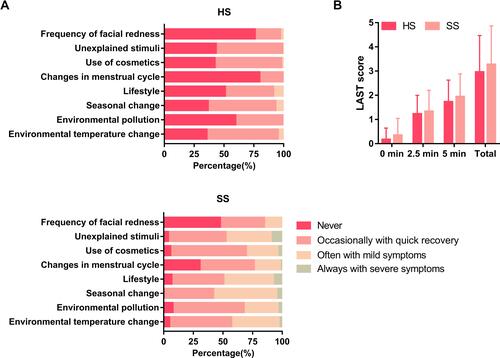
Figure 2 Biophysical parameters in healthy skin (HS) and sensitive skin (SS) subjects at three facial regions. (A) skin hydration, in arbitrary units (a.u.); (B) transepidermal water loss (TEWL), in g/m2·h; (C) sebum content, in μg/cm2; (D) lightness L* values, in arbitrary units (a.u.); (E) redness a* values, in arbitrary units (a.u.); (F) erythema index, in arbitrary units (a.u.); (G) skin elasticity R2 values, in arbitrary units (a.u.); (H) skin surface pH, in arbitrary units (a.u.). The values are expressed as mean ±SD. *p<0.05, **p 0.01 compared between HS group and SS group.
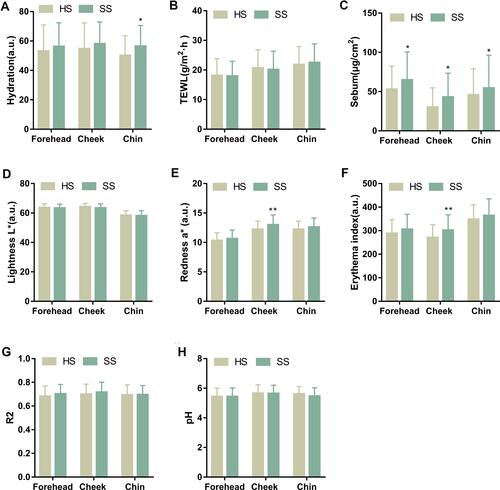
Figure 3 Biophysical parameters in LAST negative (LAST–) and LAST positive (LAST+) subjects at three facial regions. (A) skin hydration, in arbitrary units (a.u.); (B) transepidermal water loss (TEWL), in g/m2·h; (C) sebum content, in μg/cm2; (D) lightness L* values, in arbitrary units (a.u.); (E) redness a* values, in arbitrary units (a.u.); (F) erythema index, in arbitrary units (a.u.); (G) skin elasticity R2 values, in arbitrary units (a.u.); (H) skin surface pH, in arbitrary units (a.u.). The values are expressed as mean ±SD. *p<0.05, **p<0.01 compared between LAST– group and LAST+ group.
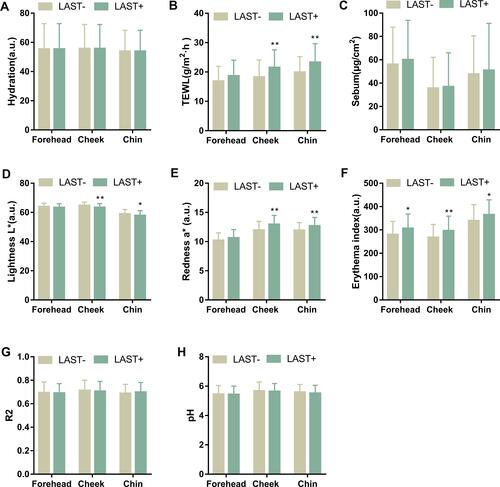
Figure 4 Biophysical parameters of healthy skin subjects who were negative (LAST–) or positive (LAST+) to LAST at three facial regions. (A) skin hydration, in arbitrary units (a.u.); (B) transepidermal water loss (TEWL), in g/m2·h; (C) sebum content, in μg/cm2; (D) lightness L* values, in arbitrary units (a.u.); (E) redness a* values, in arbitrary units (a.u.); (F) erythema index, in arbitrary units (a.u.); (G) skin elasticity R2 values, in arbitrary units (a.u.); (H) skin surface pH, in arbitrary units (a.u.). The values are expressed as mean ±SD. *p<0.05, **p<0.01 compared between LAST– group and LAST+ group.
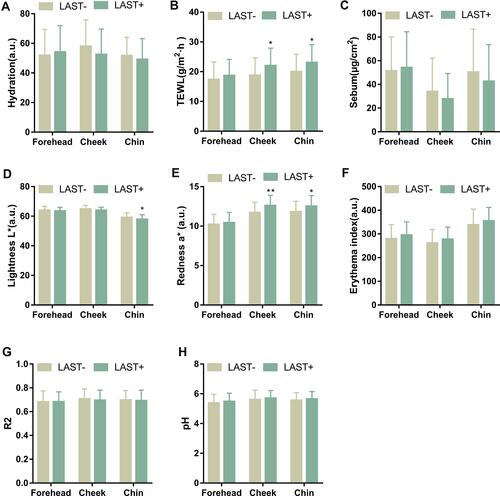
Figure 5 Biophysical parameters of sensitive skin subjects who were negative (LAST–) or positive (LAST+) to LAST at three facial regions. (A) skin hydration, in arbitrary units (a.u.); (B) transepidermal water loss (TEWL), in g/m2·h; (C) sebum content, in μg/cm2; (D) lightness L* values, in arbitrary units (a.u.); (E) redness a* values, in arbitrary units (a.u.); (F) erythema index, in arbitrary units (a.u.); (G) skin elasticity R2 values, in arbitrary units (a.u.); (H) skin surface pH, in arbitrary units (a.u.). The values are expressed as mean ±SD. *p<0.05 compared between LAST– group and LAST+ group.
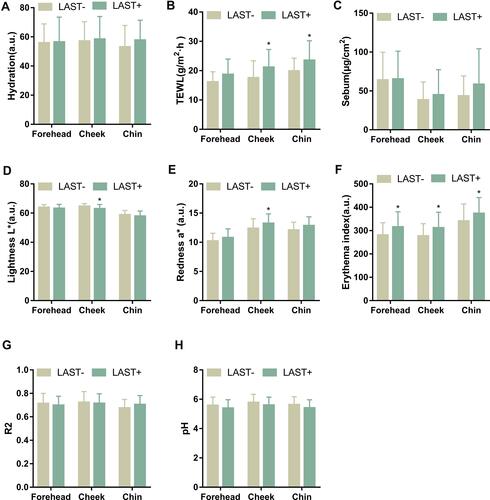
Table 2 Correlation Coefficients of the Skin Parameters on Different Facial Regions with Questionnaire Scores
Table 3 Correlation Coefficients of the Skin Parameters on Different Facial Regions with LAST Scores