Figures & data
Table 1 Explant Distribution Designated to Study RFV3 for Barrier Repair Properties
Figure 1 Degree of PPAR-α transcription activation induced by test materials depicted by the Reporter Assay System. Data are presented as mean value ± SEM, n=13 for water, n= 3 for test samples; *p-value < 0.05, **p-value < 0.01, n.s. = not significant, † = cytotoxic conditions observed.
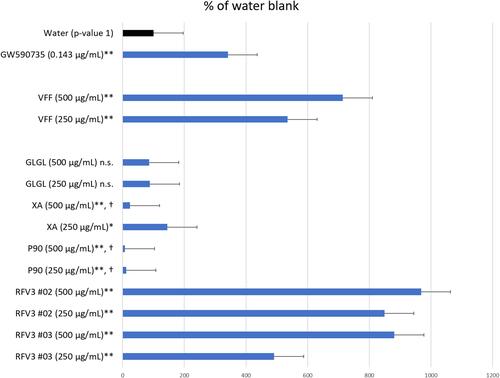
Table 2 Comparison of Pterocarpus Marsupium Bark Extract (P90) to RFV3 at Equivalent Concentrations of Trans-Pterostilbene 10.3 µm on the Transcriptional Response of the PPAR-α-Controlled Luciferase Reporter Gene. Data are Presented as Mean Values, n = 5 for Water; n = 6 for Test Samples
Table 3 Description of 36 of 96 Significantly and Near-Significantly Modulated Genes. Fold Change vs Control for Each Gene on the PCR Panel. Modulation of Gene Expression by RFV3 vs Glycerin Negative Control Expressed as Fold Change (FC; Up- or Down-Regulation)
Figure 2 Graphic representation of connectivity in genes modulated by RFV3 (2%) in epidermal tissue substitutes vs glycerin control (in silico analysis with StringDB software).
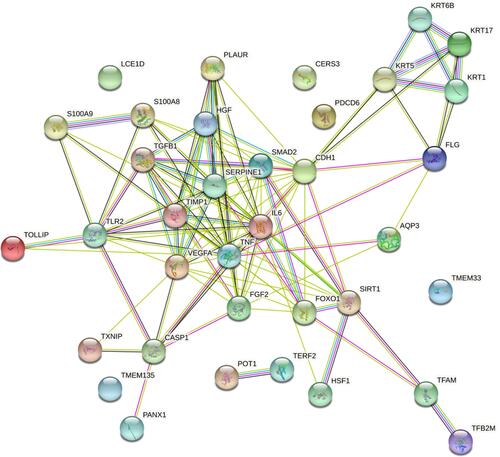
Table 4 Binding Affinity and Amino Acid Interacting Residues of GW590735, Endogenous Ligands (CLAs), Test Compounds and Complexes of Compounds. Bolded Amino Acid Interacting Residues Represent Common Binding Sites of GW590735, a Known Synthetic PPAR-α Agonist
Figure 3 Interacting amino acid residues and conformations within the LBD of PPAR-α. From left to right: (A) ximenynic acid + glyceryl linolenate at distance criterion of 2.5 Ȧ, (B) RFV3 at distance criterion of 2.5 Ȧ and (C) RFV3 at distance criterion of 6 Ȧ.
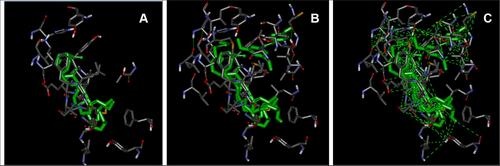
Figure 4 Microscopic evaluation of tissue and cell morphology of day 0 and day 1 explants. No alterations observed in the epidermis and dermis across all samples.
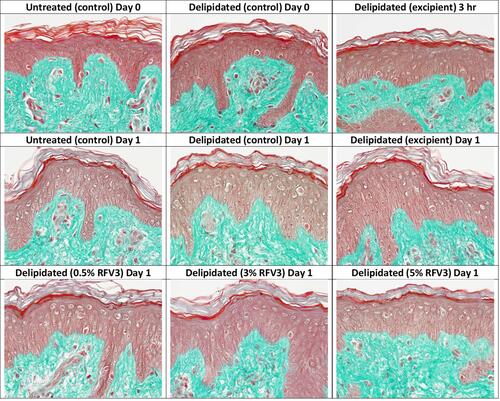
Figure 5 Immunostaining of ceramides in the stratum corneum with day 1 explants. Starting top left samples: Untreated control, delipidated control, delipidated excipient treated, delipidated 0.5% RFV3 treated, delipidated 0.3% RFV3 treated, delipidated 5% RFV3 treated.
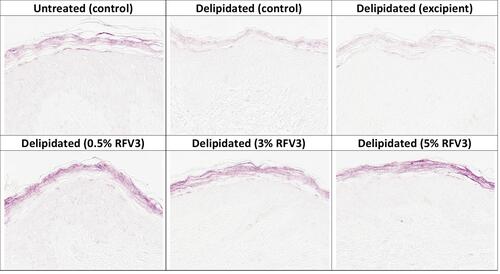
Figure 6 Image analysis for % surface positive immunostaining of ceramides in the stratum corneum of day 1 explants. Error bars represent SD. Explants analyzed: 18 (6 batches, 3 explants per batch). Image analyses n=9 (3 images per explant). Treated samples vs U(C): § for p < 0.05 and §§ for p < 0.01. Treated vs D(C): †† for p < 0.01. Treated samples vs D(E) ** for p < 0.01.
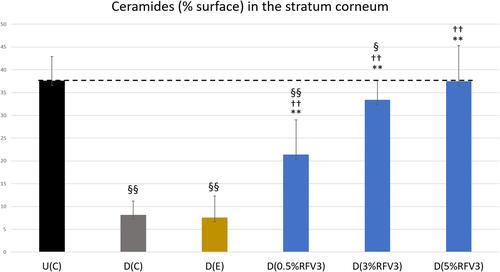
Figure 7 Immunostaining of filaggrin at the bottom of the stratum corneum with day 1 explants. Starting top left samples: Untreated control, delipidated control, delipidated excipient treated, delipidated 0.5% RFV3 treated, delipidated 0.3% RFV3 treated, delipidated 5% RFV3 treated.
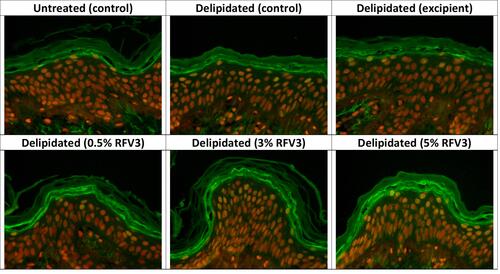
Figure 8 Image analysis for % surface positive immunostaining of filaggrin at the bottom of the stratum corneum with day 1 explants. Error bars represent SD. Explants analyzed: 18 (6 batches, 3 explants per batch). Image analyses n=9 (3 images per explant). Treated samples vs U(C): § for p < 0.05. Treated vs D(C): †† for p < 0.01. Treated samples vs D(E) ** for p < 0.01.
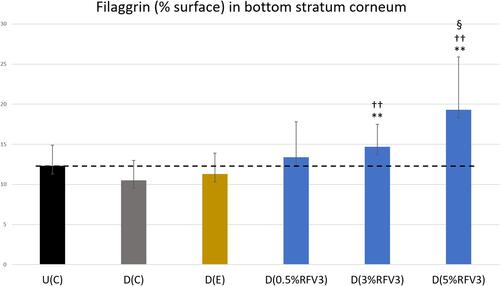
Figure 9 Immunostaining of transglutaminase-1 in the epidermis granular layer with day 1 explants. Starting top left samples: Untreated control, delipidated control, delipidated excipient treated, delipidated 0.5% RFV3 treated, delipidated 0.3% RFV3 treated, delipidated 5% RFV3 treated.
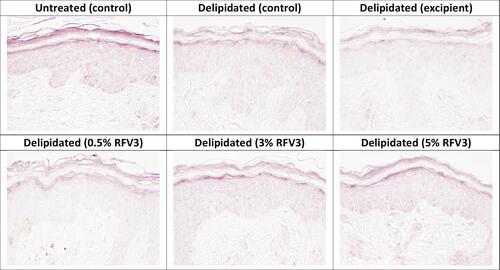
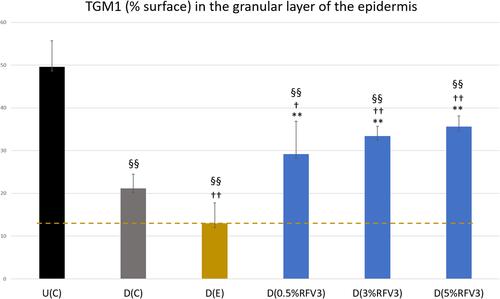
Figure 10 Image analysis for % surface positive immunostaining of transglutaminase-1 in the epidermis granular layer with day 1 explants. Error bars represent SD. Explants analyzed: 18 (6 batches, 3 explants per batch). Image analyses n=9 (3 images per explant). Treated samples vs U(C): §§ for p < 0.01. Treated vs D(C): † for p < 0.05 and †† for p < 0.01. Treated samples vs D(E) ** for p < 0.01.