Figures & data
Figure 1 Experimental design and observation indicators. (A) Schematic diagram of the study protocol. (B) Comparisons of ear thickness at the end of experimental procedure. (C) Effects of gallic acid on atopic dermatitis-like skin severity induced by DNCB. (D and E) Effects of gallic acid on serum levels of IgE (D) and TNF-α (E) in atopic dermatitis-like mice. Mean ± SD was used to shown the data. ###p < 0.001 compared to control, *p < 0.05, **p < 0.01, ***p < 0.001 compared to DNCB group. One-way ANOVA followed Dunn’s multiple comparisons test.
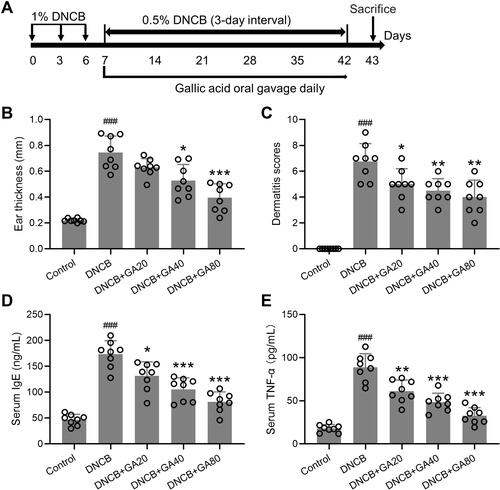
Figure 2 Histopathological observation of ear tissues from DNCB induced atopic dermatitis-like mice. (A) Representative images of hematoxylin-eosin staining for ear skin. The comparison of thickness of the epidermis and dermis (B and C). Mean ± SD was used to shown the data. ###p < 0.001 compared to control, **p < 0.01, ***p < 0.001 compared to DNCB group. One-way ANOVA followed Dunn’s multiple comparisons test.
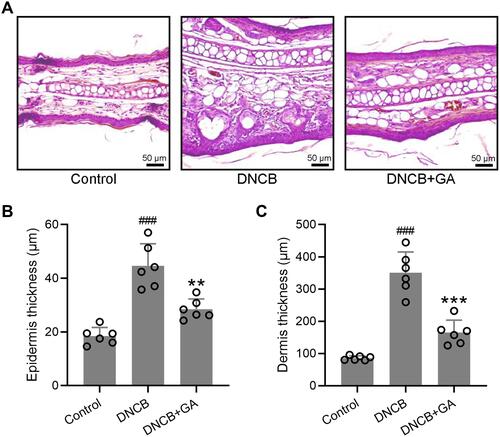
Figure 3 Effects of gallic acid on the weights of lymph node and the expression of various pathogenic factors in the lymph node. The lymph nodes were excised on day 43 and the weight were compared (A) to calculate the lymph node index (B). The total RNA was isolated and quantitative real time polymerase chain reaction was used to measure them RNA expressions of TNF-α (C), IL-4 (D), IFN-γ (E), IL-17 (F) in the lymph node tissues. Mean ± SD was used to shown the data. ##p < 0.01, ###p < 0.001 compared to control, **p < 0.01, ***p < 0.001 compared to DNCB group. One-way ANOVA followed Dunn’s multiple comparisons test, and Kruskal–Wallis test following by Mann–Whitney U-tests.
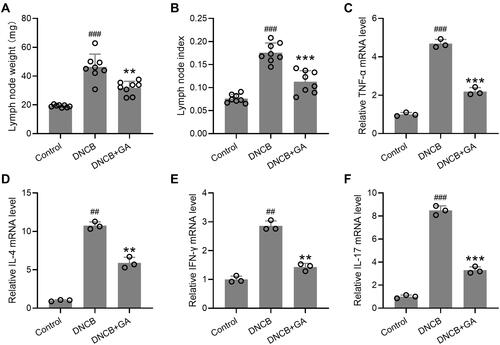
Figure 4 Effects of gallic acid on the expression of various pathogenic factors in the ear. The ears were excised on day 43 and quantitative real time polymerase chain reaction was used to measure the mRNA expressions of IL-4 (A), IL-5 (B), IL-17 (C), IL-23 (D), IL-10 (E) and TGF-β (F) in the ear tissues. Mean ± SD was used to shown the data. #p < 0.05, ##p < 0.01, ###p < 0.001 compared to control, *p < 0.05, **p < 0.01, ***p < 0.001 compared to DNCB group. Kruskal–Wallis test following by Mann–Whitney U-tests.
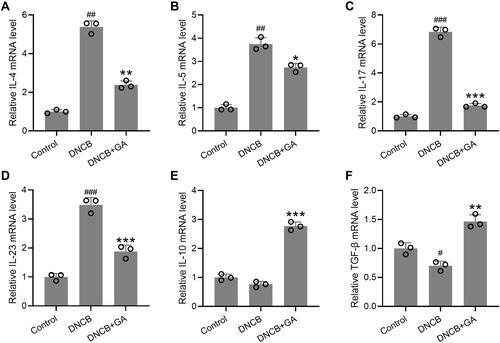
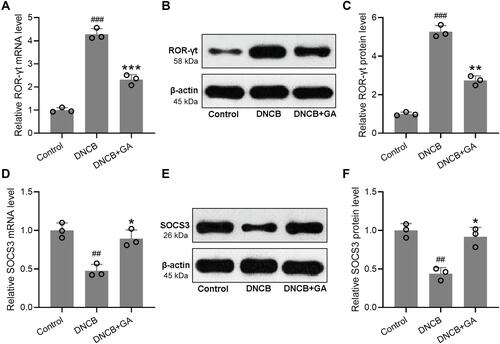
Figure 5 Effects of gallic acid on the Th17 mediated immune responses in DNCB induced atopic dermatitis-like mice. The ears were excised on day 43 and quantitative real time polymerase chain reaction was used to measure the mRNA expressions of ROR-γt (A) and SOCS3 (D) in the ear tissues. Western blotting was used to measure the protein levels of ROR-γt (B) and SOCS3 (E) in the ear tissues. The expressions were normalized to control (C and F). Mean ± SD was used to shown the data. ##p < 0.01, ###p < 0.001 compared to control, *p < 0.05, **p < 0.01, ***p < 0.001 compared to DNCB group. Kruskal–Wallis test following by Mann–Whitney U-tests.