
Figures & data
Figure 1 Possible biosynthesis and metabolic pathway of long-chain n3 PUFA.
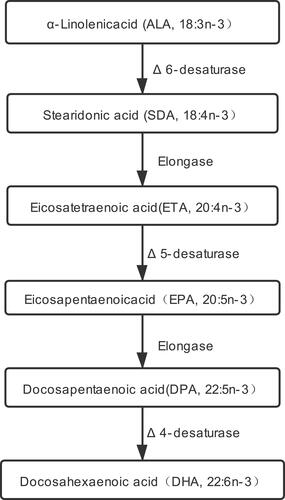
Figure 2 Flowchart of the screening process for the eligible participants selection from National Centre for Health Statistics (NHANES).
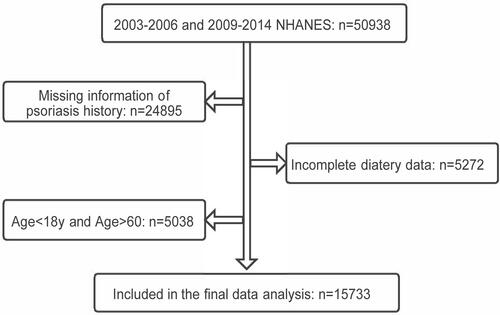
Table 1 Characteristics of Participants by Psoriasis
Table 2 Univariate and Multivariate Logistic Regression Model of Daily Dietary N3 Polyunsaturated Fatty Acids Intakes and Psoriasis
Figure 3 Smooth curve fittings show the relationship between daily dietary eicosatetraenoic acid (ETA, 20:4 n-3) intake and the risk of psoriasis overall (A) and within all subgroups (B–I). The red line presents the OR value of the association of ETA and psoriasis, and the blue lines present the 95% confidence interval (A). Smooth curve fittings from (B–I) show the association in different subgroups stratified by each covariate, and each line presents the OR value of the association without a 95% confidence interval. All smooth curve fittings show that the risk of psoriasis decreased linearly with the increase in daily dietary ETA intake overall and within all subgroups. The association was adjusted for gender, age, veteran, marital status, PIR, BMI, drinking alcohol, smoking except the stratified covariate.
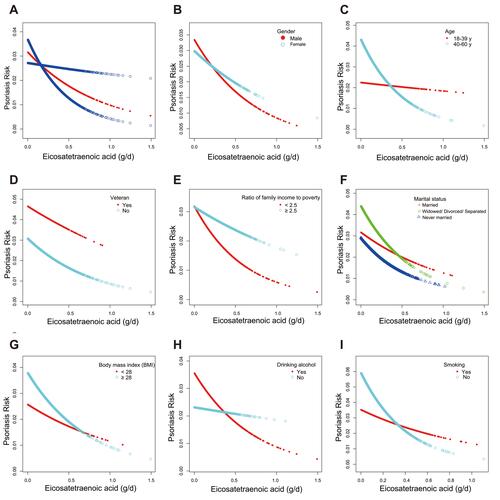
Table 3 Trend Test of Association of Daily Dietary ETA Intakes with Psoriasis
Table 4 Interaction Test of Association of Daily Dietary ETA Intakes with Psoriasis