Figures & data
Figure 1 Cell viability of niacinamide in hDPCs. (A) Chemical structure of niacinamide. (B) Cells were plated on 96-well plates with complete medium. CCK-8 assay was performed to determine cell viability after treatment with various concentrations of niacinamide (0, 0.5, 1, 2 and 4 mM) and 10 µM of minoxidil for 24 h. Data represent mean ± S.D. #p < 0.05 compared to non-treated control.
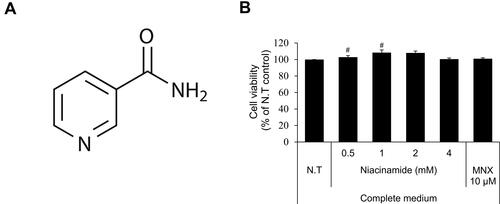
Figure 2 Niacinamide decreased the expression of DKK-1 and increased the expression of versican in hDPCs. (A) Cells (5.0 × 10⁵ cells/well) were seeded in 60 mm dishes. After 24 h, cells were treated with niacinamide (1, 2, and 4 mM) and 10 µM of MNX in complete medium for 24 h. Western bot analysis was performed using 40 μg of total protein. GAPDH was used as a loading control (B) The band intensity was quantitated. (C) Cells (2 × 10⁴ cells/well) were seeded in 24-well plates and cultured for 24 h. Cells were treated with niacinamide (1, 2, and 4 mM) and 10 µM of MNX in complete medium for 24 h. After treatment, culture medium from each well was analyzed using DKK-1 ELISA kit. (D) Versican expression was visualized as green by fluorescent microscopy. The scale bar represents 200 μm. Data represent mean ± SD. #p < 0.05 and ##p < 0.01 compared to non-treated.
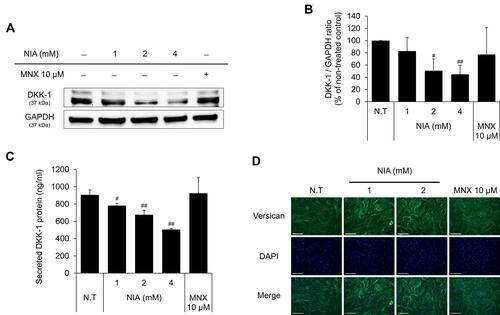
Figure 3 Effects of niacinamide on H2O2-induced oxidative stress. (A) Protective effect of niacinamide on H2O2-induced ROS generation. Niacinamide (1, 2 and 4 mM) was treated with 1 mM H2O2 for 30 min. After treatment, cells were stained with DCF-DA probe for 30 min and fluorescent images were obtained. The scale bar represents 200 μm. (B) ROS generation was quantitated using Celleste™ Image Analysis Software. (C) LDH release was assessed in hDPCs following H2O2 exposure for 24 h. (D) Protective effect of niacinamide on H2O2-induced LDH release. Niacinamide (1, 2 and 4 mM) was treated with 750 µM H2O2 for 24 h. Data represent mean ± S.D. #p < 0.05 and ##p < 0.01 compared to non-treated control. *p < 0.05, **p < 0.01 compared to H2O2-treated control.
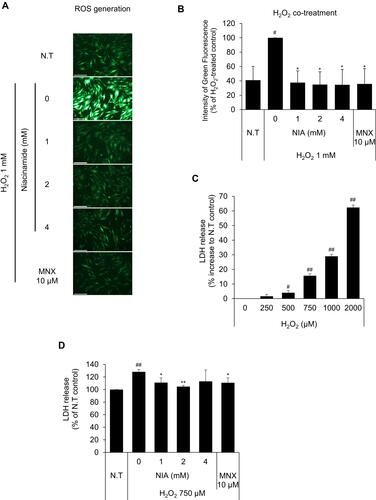
Figure 4 Continued.
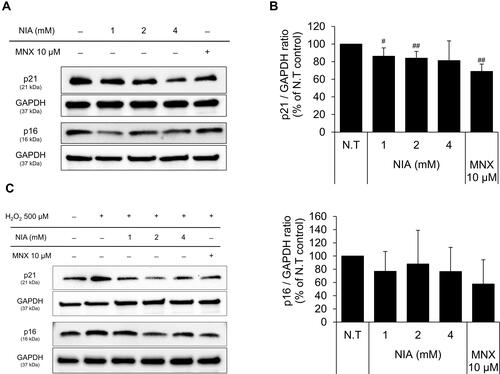
Figure 4 Effects of niacinamide on protein and mRNA expression of cyclin dependent kinase Inhibitors in hDPCs with and without H2O2 treatment. (A) Cells (5.0 × 10⁵ cells/well) were seeded in 60 mm dishes. After 24 h, cells were treated with niacinamide (1, 2, and 4 mM) and 10 µM of MNX in complete medium for 24 h. Western bot analysis was performed using 40 μg of total protein. GAPDH was used as a loading control (B) The band intensity was quantitated. Data represent mean ± SD (n = 4) (C) Cells (5.0 × 10⁵ cells/well) were seeded in 60 mm dishes and cultured for 24 h, then medium was replaced with serum limitation medium. After serum limitation for 24 h, cells were treated with various concentrations of niacinamide (1, 2 and 4 mM) and 10 µM of MNX in the presence of 500 µM of H2O2 for 24 h. Western bot analysis was performed using 40 μg of total protein. GAPDH was used as a loading control (D) The band intensity was quantitated. Data represent mean ± SD (n = 4) (E) Cells (1.5 × 10⁵ cells/well) were seeded in 6-well plates and incubated for 24 h. After serum limitation for 24 h, niacinamide was treated at concentrations of 1, 2, and 4 mM for 24 h in the presence of H2O2. The mRNA expression levels of p21 (CDKN1A) and p16 (CDKN2A) were measured by RT-PCR. Data represent mean ± SD (n = 3). #p < 0.05 and ##p < 0.01 compared to non-treated control. *p < 0.05 and **p < 0.01 compared to H2O2-treated control.
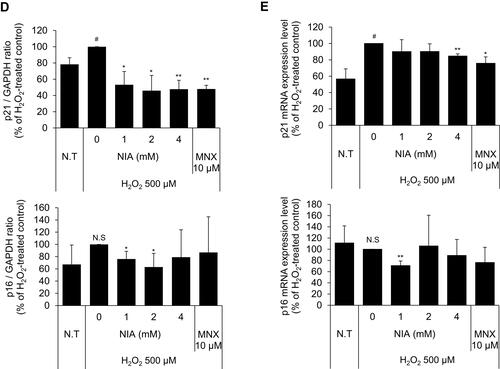
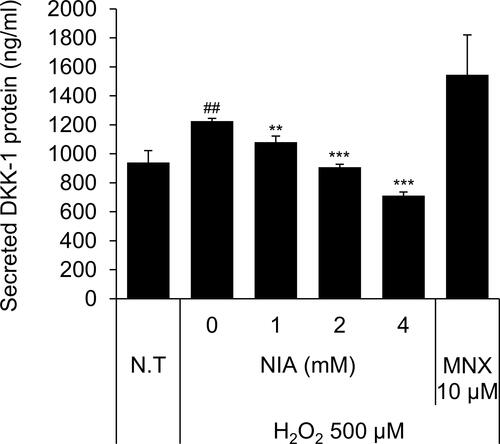
Figure 5 Niacinamide decreased H2O2-induced DKK-1 protein secretion in hDPCs. Cells (2 × 10⁴ cells/well) were seeded in 24-well plates and cultured for 24 h, then medium was replaced with serum limitation medium. After serum limitation for 24 h, cells were treated with various concentrations of niacinamide (1, 2 and 4 mM) and 10 µM of MNX in the presence of 500 µM of H2O2 for 24 h. After treatment, culture medium from each well was analyzed using DKK-1 ELISA kit. Data represent mean ± SD (n = 4). ##p < 0.01 compared to non-treated control. **p < 0.01 and ***p < 0.001 compared to H2O2-treated control.