Figures & data
Figure 1 (A) Wound images of the NPWT and control groups on days 0, 3, 5, 7, 9, 11, and 13 post surgery. (B) Percentage of wound closure. (C) Wound-healing times. *p < 0.05, **p < 0.01, ***p < 0.001.
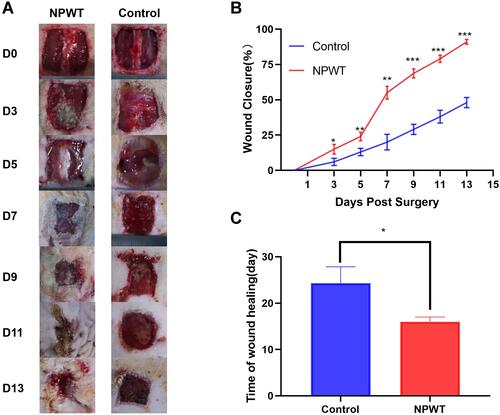
Figure 2 Anti-CD31 immunohistochemistry assays. Scale bar = 200 µm or 50 µm.
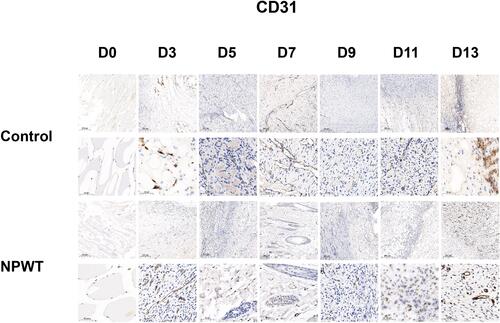
Figure 3 Anti-CD68 immunohistochemistry assays. Scale bar = 200 µm or 50 µm.
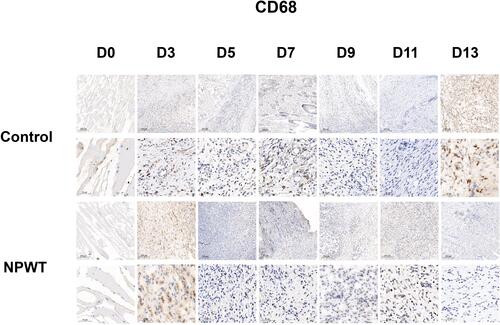
Figure 4 (A) Quantification of blood-vessel density by measuring the percentage of CD31-positive area on days 0, 3, 5, 7, 9, 11, and 13 post surgery. (B) Quantification of inflammation by measuring the percentage of CD68-positive area on days 0, 3, 5, 7, 9, 11, and 13 post surgery. *p < 0.05, **p < 0.01.
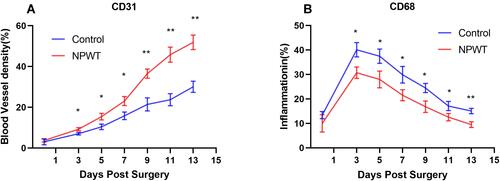
Figure 5 The level of MDA (as a measure of free oxygen radicals) of the control and NPWT-treated groups was tested on days 0, 3, 5, 7, 9, 11, and 13 post surgery. *p < 0.05.
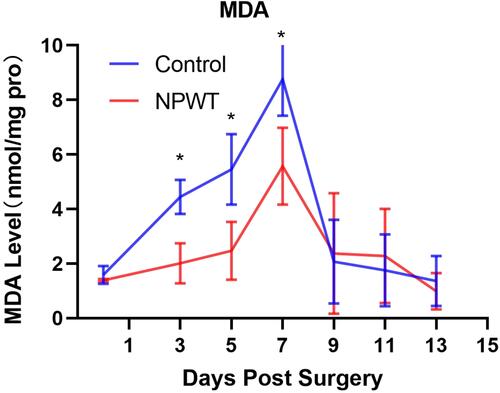
Figure 6 (A) SOD activity of the control and NPWT-treated groups was tested on days 0, 3, 5, 7, 9, 11, and 13 post surgery. (B) CAT activity of the control and NPWT-treated groups was tested on days 0, 3, 5, 7, 9, 11, and 13 post surgery. * p < 0.05.
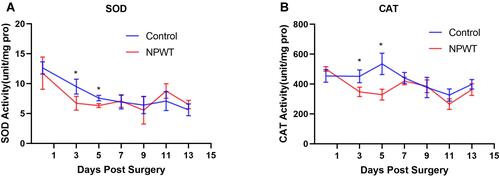
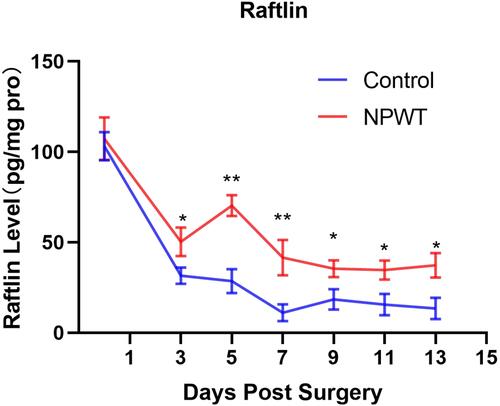
Figure 7 Raftlin levels of the control and NPWT-treated groups were tested on days 0, 3, 5, 7, 9.11, and 13 post surgery. * p < 0.05, ** p < 0.01.