Figures & data
Figure 1 Area coverage index (ACI) definition, calculation formula and pixel transformation method. The figure describes the method proposed by the author to portray the visual aspect of the scalp as a function of the hair density and average hair thickness, by the (A) unit definition, (B) calculation and (C) pixel transformation of an area coverage index (ACI).
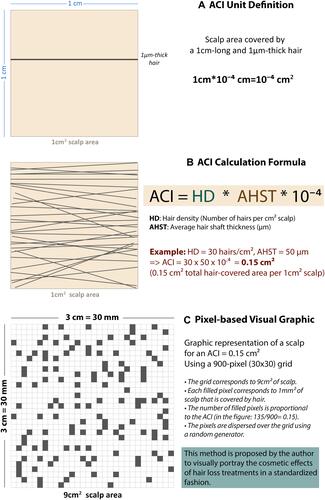
Table 1 Pre- and Post-Intervention Trichometry Findings by Scalp Region (Intrasubject Analysis)
Figure 2 Change in key indicators of hair growth, by scalp region, in male and female androgenic alopecia after treatment with autologous cellular micrografts (ACM). Pictures depict: 1) relative pre- to post-intervention change (in percent, left panels) of the 5 positive (green bars) and 2 negative (Orange bars) parameters as adjusted by the respective baseline population mean, that is, bar heights represent the percentage of change in the given parameter by reference to the baseline population mean; 2) mean derived Sinclair grade (right panels) in baseline versus after treatment with ACM. Panels correspond to findings in different scalp regions including frontal (A), temporal (B), and occipital (C) regions.
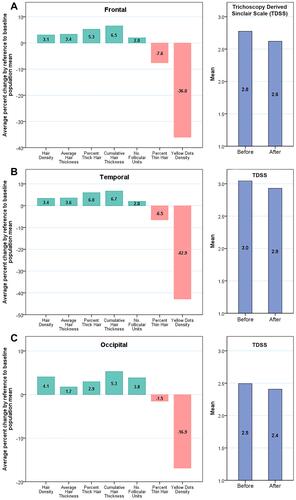
Figure 3 Short-term hair growth in male and female androgenic alopecia after treatment with autologous cellular micrografts (ACM). Pictures depict pre- to post-intervention change in area coverage index (ACI) in the frontal (A), temporal (B), and occipital (C) regions. Each grid represents 9cm2 (3×3cm) of scalp area; where gray cells represent the scalp area covered by hair, white cells represent the scalp areas not covered by hair, and dark gray cells represent highly dense areas indicating ACI > 1cm2.
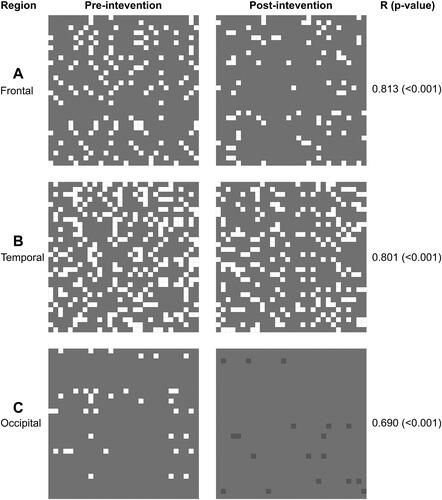
Table 2 Change in Hair Growth Indicators Among Favorable Responders
Table 3 Hair Growth Indicators by Gender and Scalp Region in Male and Female Androgenic Alopecia After Treatment with Autologous Cellular Micrografts (ACM)
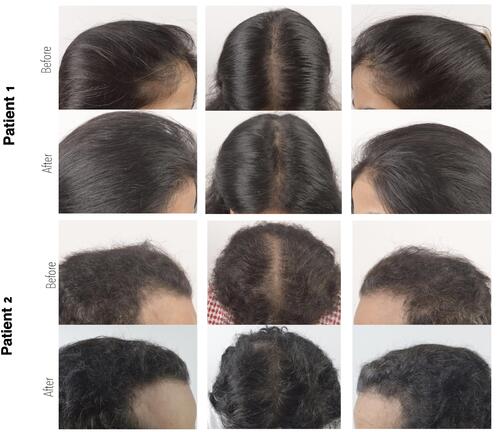
Figure 4 Pre and post treatment scalp photographs of a sample female and male patients with androgenetic alopecia, before and after treatment with autologous cellular micrografts (ACM). Photographs show cosmetic improvement after autologous cellular micrografts in a female (1) and a male (2) patient. In the female patient (1), there was increase in CHT from 10.3, 7.5 and 9.9 to 10.5, 8.3 and 12 mm/cm2 in frontal, temporal and occipital areas, respectively. In the male patient (2), there was increase in CHT from 12.7 to 13.2 mm/cm2 in the frontal and 8.8 to 12.3 mm/cm2 in the occipital area, while CHT decreased from 8.5 to 7.5 mm/cm2 in the temporal area.