Figures & data
Figure 1 Macroscopic observations of the hair growth and hair cycle in vivo. (A) Macroscopic pictures of mice on day 0, day 7, day 14 and day 18. The area circled by the red line is the measurement area of grayscale in (B). (B) The corresponding skin color grayscale ratio on day 0, day 7, day 14 and day 18. (C) Mean hair length on day 18 of each group. Data were presented as mean ± SD, n = 3 in each group. The experiments were performed three times with similar results. ns: no significant difference. *P<0.05, **P<0.01, ****P < 0.0001.
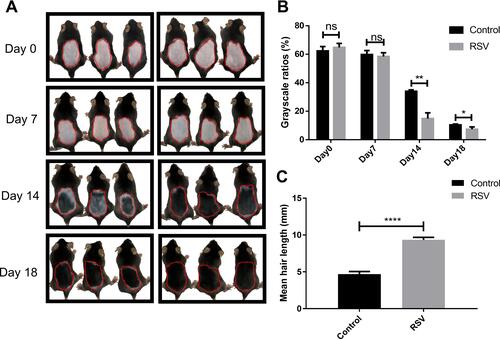
Figure 2 RSV induces anagen entry and development in vivo. (A) A representative histological section of the shaved sites on day 5 after treating with RSV or vehicle. Original magnification was ×100. Red lines indicate the hair bulb diameter. (B) Skin thickness of each group on day 5. (C) The largest hair follicle diameter of each group on day 5. (D) Hair follicles score on day 5. (E) The percentage of three anagen phase. From the left to the right: anagen I-anagen IIIa, anagen IIIb-IIIc and anagen IV–VI. (F) Representative image of Ki67 staining on day 7. (G) Representative image of TUNEL staining on day 7. Data were presented as mean ± SD, n = 3 in each group. The experiments were performed three times with similar results. *P<0.05, **P<0.01.
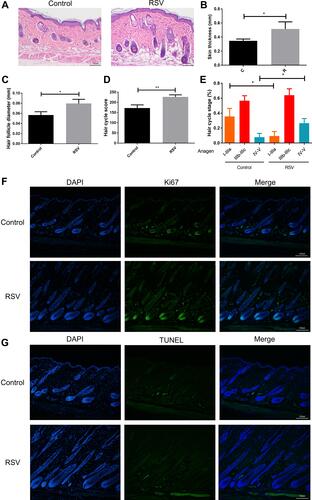
Figure 3 RSV delays catagen entry and increases the length of HFs ex vivo. The HFs were cultured with RSV for 6 days. (A) Photographs of HFs being cultured every other day. (B) Change in hair shaft length of HFs cultured with RSV for 6 days after isolation. (C) Photographs of the bulb in HFs being cultured every other day. (D) Macroscopic quantification of hair cycle stage on day 6 with RSV treatment. (E) Representative image of Ki67 staining on day 2. (F) Representative image of TUNEL staining on day 2. Data are presented as mean ± SD, n = 3 in each group. The experiments were performed three times with similar results. *P<0.05, **P<0.01.
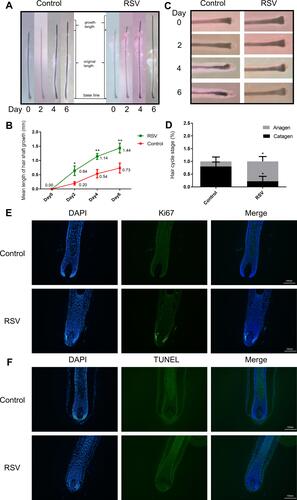
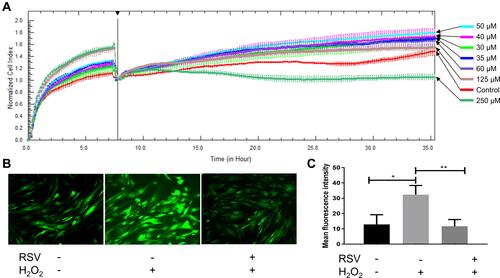
Figure 4 RSV promotes proliferation of cultured hDPCs and protects hDPCs against oxidative stress. (A) Growth curves (measured as cell index over time) of hDPCs treated by RSV with different concentrations. All growth curves were measured with the RTCA system. (B) Photographs taken by fluorescence microscope. (C) Quantification of mean fluorescence intensity of each group. Data are presented as mean ± SD; *P < 0.05; **P < 0.001. The experiments were performed three times with similar results. +, hDPCs were treated with relative materials; -, hDPCs were treated without relative materials.