Figures & data
Figure 1 Identification of DEGs between psoriasis patients and healthy controls. (A) Volcano plot of DEGs. Red points represent up-regulated genes; green points represent down-regulated genes. (B) The heatmap of DEGs. Red colors indicate up-regulated genes and green colors indicate down-regulated genes.
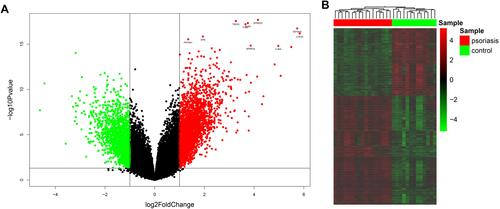
Figure 2 Gene ontology enrichment analysis of DEGs in psoriasis patients.
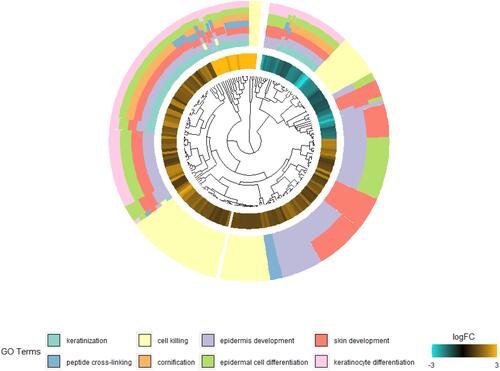
Figure 3 PPI network of differentially expressed genes. (A) PPI network of DEGs constructed by STRING and visualized using Cytoscape. (B) The significant module was identified from the PPI network.
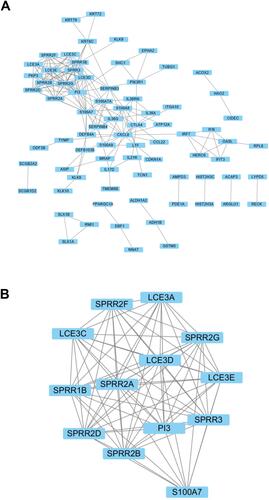
Figure 4 Validation of DEGs in psoriasis mice of dataset GSE63684. Expression levels of (A) SPRR and (B) LCE were significantly upregulated in psoriasis mice. *P<0.05, ***P<0.001 and ****P<0.0001. (C) GO enrichment analysis of DEGs in psoriasis mice.
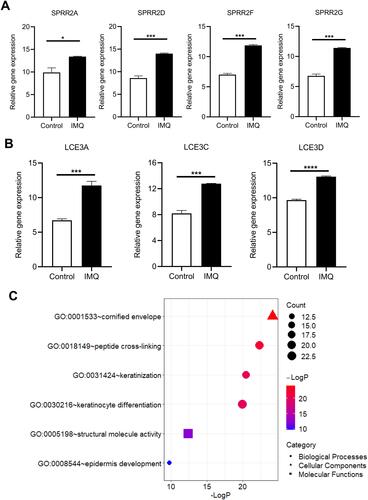
Figure 5 The interaction of between SPRR and LCE. (A) The correlation between LCE3D and SPRR2. (B) The correlation between LCE and SPRR. (C) SPRR2 proteins colocalize with LCE3D upon co-expression in 293T cells. Nuclei were stained using 4′,6-diamidino-2-phenylindole (DAPI). Scale bar represents 10 μm. (D) Immunoassay of lysates of 293T cells transfected with plasmids encoding LCE3D and SPRR2A; LCE3D and SPRR2F, followed by immunoprecipitation (IP) with anti-HA, anti-Flag or the control antibody immunoglobulin G (IgG) and immunoblot analysis (IB) with anti-HA or anti-Flag.
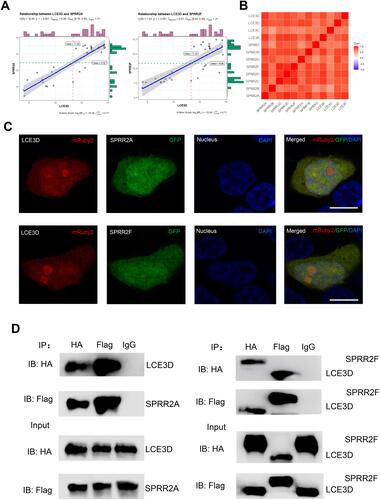
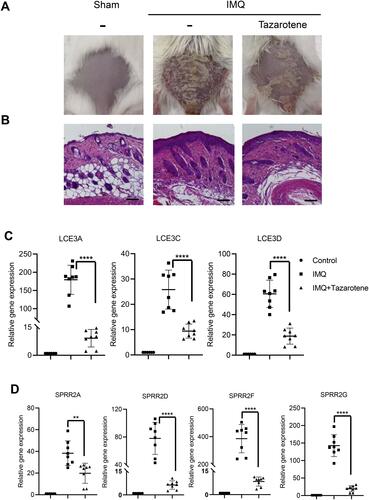
Figure 6 Expression of SPRR and LCE genes were significantly up-regulated in a model of psoriasiform dermatitis. (A) Photograph of mice back skin was taken on day 7. (B) H&E staining of back skin sections were examined on day 7. Scale bar represents 50 μm. (C and D) SPRR and LCE gene expression levels in the skin lesions were evaluated by RT-qPCR. The results are presented as the means ± standard deviation. All experiments were performed 3 times, and the representative results are presented. **P<0.01 and ****P<0.0001.