
Figures & data
Table 1 Socio-Demographic Characteristics of Respondents
Table 2 Distribution and Reliability of SPS-R and Its Sub-Scales
Table 3 Measurement Model Summary Table for the PLS-PM Model
Figure 1 Node diagram for the measurement model of the PLS-PM model with loadings shown.
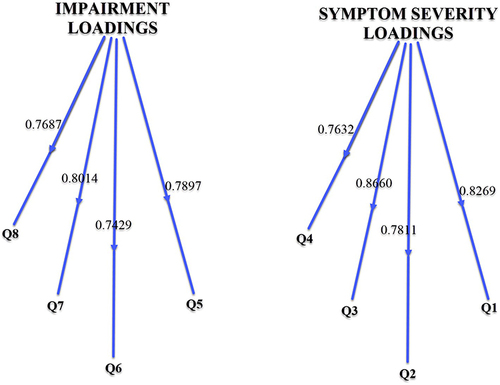
Table 4 Results for Linear Regression with Social Status, Depression Diagnosis, and Skin Picking