Figures & data
Figure 1 Purity of CD14+ monocytes measured by flow cytometer, q-PCR and Western blot for miR-155 and SOCS1 protein. (A) Purity of CD14+ monocytes. (B) Histogram of miR-155 gene expression. (C) Western blot of SOCS1 protein. (D) Histogram of SOCS1 expression. *P<0.05, **p<0.01, n=3.
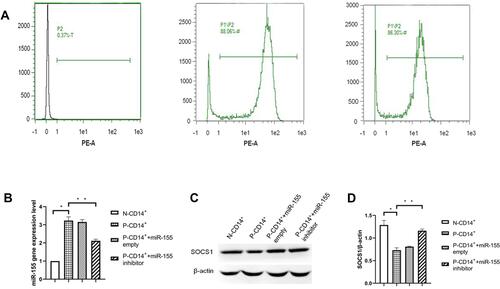
Figure 2 miR-155 and TLR4 regulate CD14+ monocyte proliferation. (A) EdU fluorescence staining (×20). (B) P-CD14+ proliferation assessed by EdU assay. (C) P-CD14+ proliferation assessed by CCK8 assay. *P< 0.05, **p<0.01, n=3.
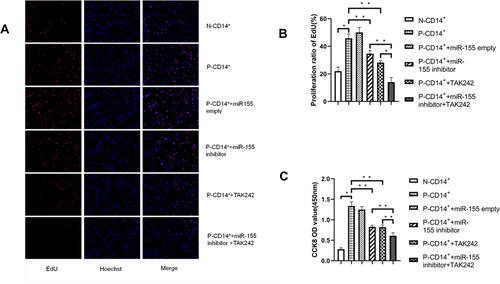
Figure 3 Expression of TLR4 and its downstream signaling. (A) Western blot of TLR4 and MyD88 protein. (B) Expressions of TLR4 and MyD88. (C) Expression of NF-κB and NF-κB-p65 mRNA. (D) Expression of TNF-α and IL-6. *P< 0.05, **p<0.01, n=3.
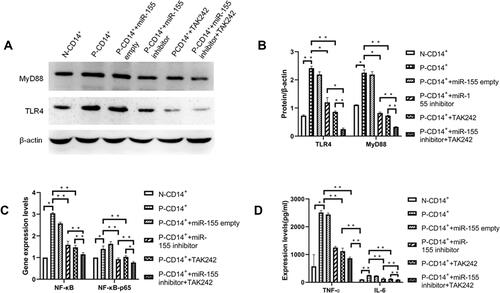
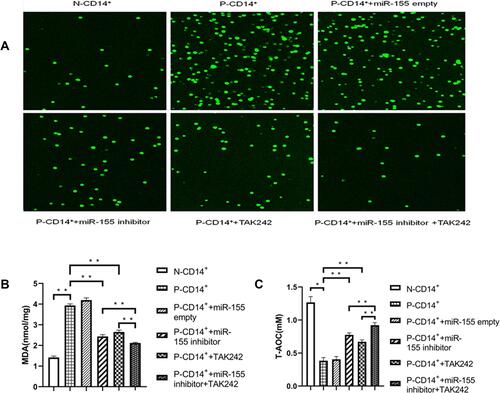
Figure 4 Inhibition of miR-155 decreases oxidative stress. (A) Fluorescence of ROS (×10). (B) MDA levels. (C) T-AOC levels. *P< 0.05, **p<0.01, n=3.