Figures & data
Table 1 Baseline Demographics of Enrolled Patients
Table 2 Mean Brown Score at Baseline, Week 1, Week 2, Week 4 and Week 6 Follow-Up Visit
Figure 1 (A) Mean brown score (B) Mean porphyrins count (C) Mean change of inflammatory acne lesion counts (D) Mean change of non-inflammatory acne lesion counts at baseline, week 1, week 2, week 4 and week 6 follow-up visit. (***P < 0.05, compared between two products, *P < 0.05, compared with baseline).
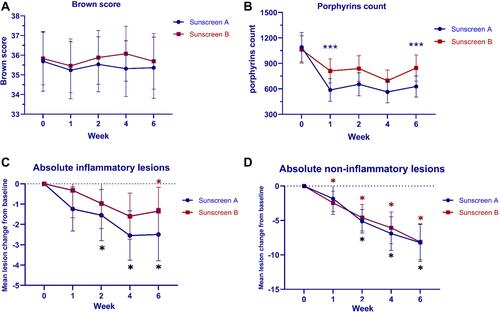
Figure 2 Postoperatively treated side with the sunscreen A. (A) Baseline, (B) 1-week 1, (C) 2-week, (D) 4-week, and (E) 6-week follow-up visit.

Figure 3 Postoperatively treated side with the sunscreen B. (A) Baseline, (B) 1-week 1, (C) 2-week, (D) 4-week, and (E) 6-week follow-up visit.