Figures & data
Table 1 Inclusion criteria
Figure 1 Antioxidant evaluation. (A) Derivatives of reactive oxygen metabolites test (Carratelli units). (B) Oxyadsorbent test (mmol HClO/L) both as a function of time in days (dd).
Notes: Data are reported as the mean ± standard error of the mean. Intergroup statistical analysis (active versus placebo) is reported inside the bars of the histogram. The lines report the intragroup statistical analysis (T60 vs T0). Statistical analysis is marked with (*) in increasing numbers depending on significance.
Abbreviation: d-ROMs, derivatives of reactive oxygen metabolites test.
Abbreviation: d-ROMs, derivatives of reactive oxygen metabolites test.
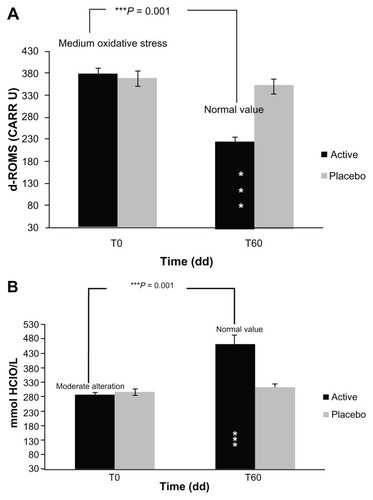
Figure 2 Skin Antioxidant capacity: FRAP test- (μmol Fe2+/L) as a function of time in days (dd).
Notes: Data are reported as mean ± SEM. Intergroup statistical analysis (active vs placebo) is reported inside the bars of the histogram. The lines report the intragroup statistical analysis (T60 vs T0). Statistical analysis is marked with (*) in increasing numbers depending on significance.
Abbreviation: FRAP test, ferric-reducing ability of plasma test.
Abbreviation: FRAP test, ferric-reducing ability of plasma test.
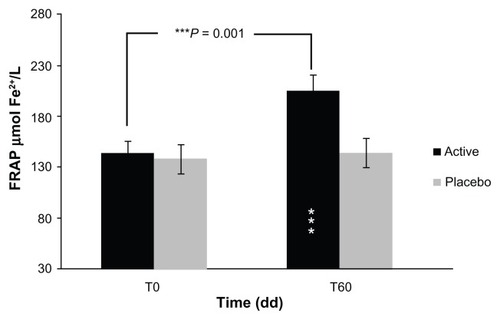
Figure 3 Skin antiaging effect. (A) Skin moisturization (corneometric units). (B) Skin elasticity (R2 parameter) – (Ua/Uf ratio) both as a function of time in days (dd).
Notes: Data are reported as the mean ± standard error of the mean. Intergroup statistical analysis (active versus placebo) is reported inside the bars of the histogram. The lines report the intragroup statistical analysis (T60 vs T0). Statistical analysis is marked with (*) in increasing numbers depending on significance.
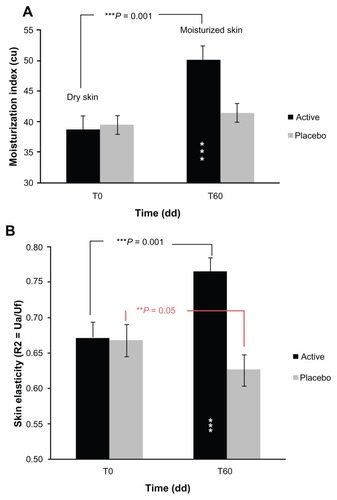
Figure 4 Skin surface (μm). (A) Skin roughness. (B) Wrinkle depth, both as a function of time in days (dd).
Notes: Data are reported as the mean ± standard error of the mean. Intergroup statistical analysis (active versus placebo) is reported inside the bars of the histogram. The lines report the intragroup statistical analysis (T60 vs T0). Statistical analysis is marked with (*) in increasing numbers depending on significance.
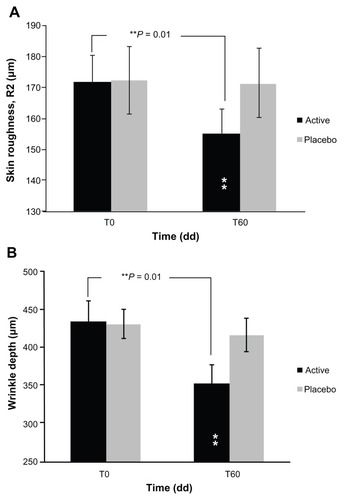
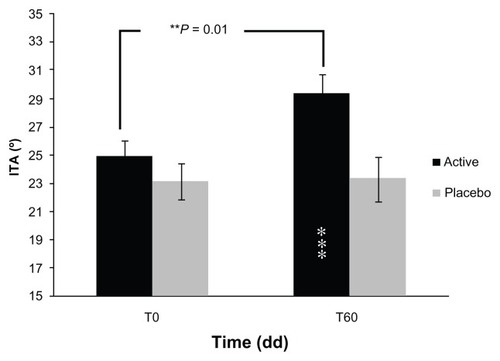
Figure 5 Intensity of brown spot: ITA° - grades (°) as a function of time in days (dd).
Notes: Data are reported as the mean ± standard error of the mean. Intergroup statistical analysis (active versus placebo) is reported inside the bars of the histogram. The lines report the intragroup statistical analysis (T60 vs T0). Statistical analysis is marked with (*) in increasing numbers depending on significance.