Figures & data
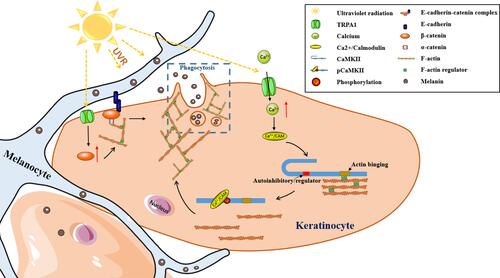
Figure 1 TRPA1 channels regulated UVA/UVB-induced Ca2+ responses in HaCaT cells. (A) Fluo-4 AM fluorescence intensity indicating calcium concentration was detected by flow cytometry in HaCaT cells after exposure to UVA (225 mJ/cm2) or UVB (25 mJ/cm2) with or without retinal preincubation (12 µM). (B and C) Quantification of the fluorescence intensity at different treatments. Values are mean value of relative fluorescence intensity normalized to control from three independent tests ±SD. (D) Calcium imaging was observed by fluorescence confocal microscopy after treatment with UVA or UVB exposure, JT010 (1 µM, TRPA1 agonist), HC-030031 (10 µM, TRPA1 antagonist), or HA-TRPA1. (Fluo-4 AM, green fluorescence). (**p < 0.01; ***p < 0.001).
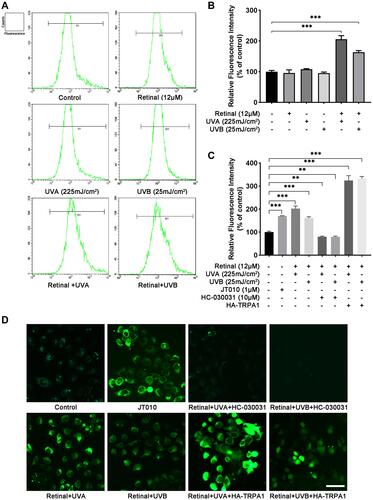
Figure 2 UVR-induced phosphorylation of CaMKII and keratinocyte phagocytosis was regulated by TRPA1 in HaCaT cells. TRPA1 channels promoted phosphorylation of CaMKII (A and B), (A) the protein levels of CaMKII and phosphorylated CaMKII (pCaMKII) were measured by Western blot in HaCaT cells, which were treated with UVA or UVB exposure, JT010 (1 µM, TRPA1 agonist), HC-030031 (10 µM, TRPA1 antagonist). (B) Relative protein levels of pCaMKII to CaMKII. Values are mean value of the ratio relative to control from three independent tests ± SD. (C) Quantification of fluorescence intensity indicating the uptake of fluorescent microspheres by HaCaT cells detected by Flow cytometry. Values are expressed as mean ±SD from three independent tests. (D) Fluorescent microspheres uptake was observed by fluorescence confocal microscopy, with red fluorescence indicating microspheres (0.5 µm microspheres), and green fluorescence indicating cell membrane stained with DiO. HaCaT cells were treated with UVA or UVB exposure, or JT010 (1 µM), HC-030031 (10 µM). Scale bar: 50 µm. (E) Quantification of fluorescent microspheres per HaCaT cell. Values are expressed as mean ± SD from three independent tests. (**p < 0.01; ***p < 0.001).
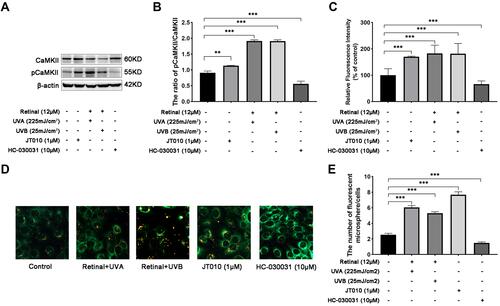
Figure 3 TRPA1 enhanced the expression of β-catenin promoting phagocytosis in HaCaT cells. (A) The protein levels of TRPA1 and β-catenin were measured by Western blot in HaCaT cells, which were treated with UVA or UVB exposure, JT010 (1 µM, TRPA1 agonist), or overexpressed with HA-TRPA1 respectively. (B and C) Quantification of TRPA1 and β-catenin protein expression levels. Values are mean value of protein expression normalized to β-actin and relative to control from three independent tests ± SD. (D) The protein levels of β-catenin were measured by Western blot in HaCaT cells, which were treated with XAV-939 (10 µM, decreasing β-catenin expression) alone or before exposure to UVA/UVB. (E) Quantification of β-catenin protein expression levels. Values are mean value of protein expression normalized to β-actin and relative to control from three independent tests ± SD. (F) Quantification of fluorescence intensity indicating the fluorescent microspheres uptake was detected by Flow cytometry in HaCaT cells. Values are expressed as mean ±SD from three independent tests. (G) Fluorescent microspheres uptake was observed by fluorescence confocal microscopy, with red fluorescence indicating microspheres, and green fluorescence indicating cell membrane stained with DiO. HaCaT cells were treated with XAV-939 (10 µM) alone or before exposure to UVA/UVB respectively. Scale bar: 50 µm. (H) Quantification of fluorescent microspheres per HaCaT cell. Values are expressed as mean ± SD from three independent tests. (*p < 0.05; **p < 0.01; ***p < 0.001).
Figure 4 β-catenin regulated the UVB-induced skin pigmentation on Guinea pig models. (A) Effect of β-catenin on regulation of UVB-induced skin pigmentation in Guinea pigs. (A) Photographs of the lightening effect of XAV-939 (10 mM) on UVB-induced skin pigmentation. (B-C) H&E staining and M&F (Masson-Fontana) staining of biopsy specimens from the Control, Vehicle (33% poloxamer gel), or XAV-939 (10 mM in 33% poloxamer gel)-treated dorsal skin areas of brown Guinea pigs (200×). (B) Quantification of L value was measured by colorimeter at the end of the experiment and values are expressed as mean ± SD from three independent tests. (C) Quantitative analysis of melanin granules stained by M&F. Values are expressed as mean ± SD from three independent tests. (***p < 0.001).
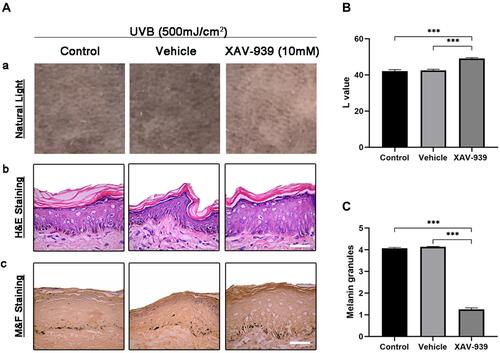
Figure 5 Schematic modulation of UVR-induced phagocytosis by TRPA1 in keratinocytes. TRPA1 is activated by UVR to increase the intracellular calcium, which promotes the phosphorylation of CaMKII, contributing to keratinocyte phagocytosis through the remodeling of F-actin. Moreover, TRPA1 activated by UVR increases the expression of β-catenin to enhance keratinocyte phagocytosis through cell-cell adhesion and cytoskeleton dynamics.