Figures & data
Figure 1 (A) Diagram representing the as-produced nanoemulsion, (B) typical transmission electron micrograph of the as-produced nanoemulsion, (C) typical hydrodynamic size distribution of the 5-aminolevulinic acid-loaded nanoemulsion obtained by dynamic light scattering, and (D) typical zeta potential distribution of the 5-aminolevulinic acid-loaded nanoemulsion obtained by electrophoretic measurement.
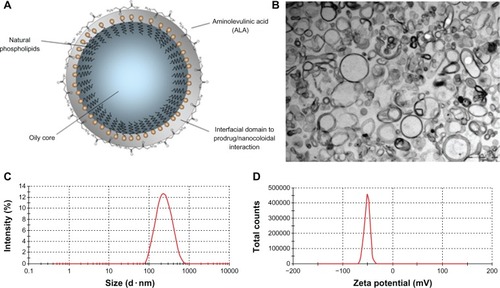
Table 1 Physicochemical parameters of nanocapsules loaded and not loaded with 5-aminolevulinic acid
Figure 2 White polygon on both images defines the region of interest for color segmentation of field cancerization.
Notes: The left panel is the original image and the right panel is the treated image with the segmented area shown in red. Note that the software has a feature that allows the user to map the edges of field cancerization simultaneously in the two images in order to assess the quality of the segmentation process.
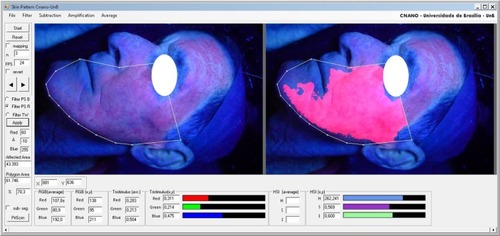
Figure 3 Sequence of images showing the time course of photodynamic therapy.
Note: The upper panel shows the right side of the patient’s face (using MAL) and the lower panel shows the left side of the patient’s face (treated with 5-aminolevulinic acid-loaded nanoemulsion).
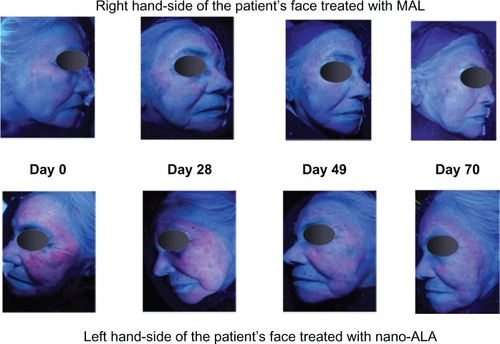
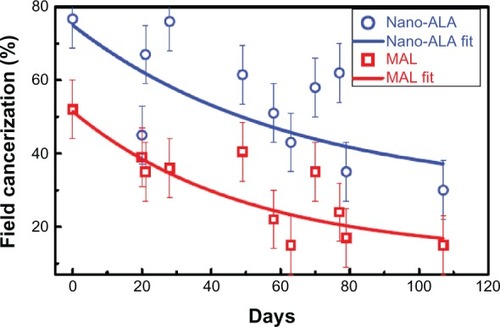
Figure 4 Time decay of field cancerization.
Notes: Symbols (open circles and squares) represent the experimental points and the solid lines going through the symbols represent the best curve-fitting according to time-dependent exponential decay. Symbols and the corresponding fitted solid lines are shown in blue for 5-aminolevulinic acid-loaded nanoemulsion (open circles) and red for MAL (open squares).