
Figures & data
Figure 1 (A) Skin elasticity measurement process. (B) R0 (skin distensibility) represents the passive behavior of the skin to force (ie, gravity). Conceptually R0 parameter is correlated to skin firmness. (C) R2 (Ua/Uf, gross elasticity or overall elasticity) represents the ability of the skin to return to its basal state.
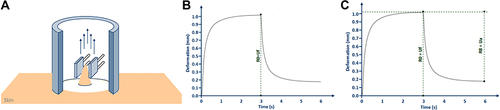
Table 1 Clinical Scoring System
Table 2 Subjects’ Baseline Demographic and Clinical Characteristics
Figure 2 (A) Bags under the eye volume results. (B) Dark circles color results (a*, red component). (C) Dark circles color results (b*, blue component). Data are average (± standard error). The statistical analysis (D28 vs D0) is reported above the bar as follows: ** p<0.01. au arbitrary units. D0 baseline. D28 follow-up visit after 28 days of product use.
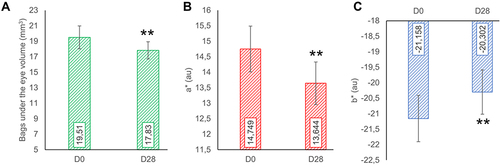
Figure 3 (A) Periocular wrinkles (standard general white lighting). (B) Bags under the eye volume results (standard general white lighting). (C) Dark circles color (cross-polarized filter).
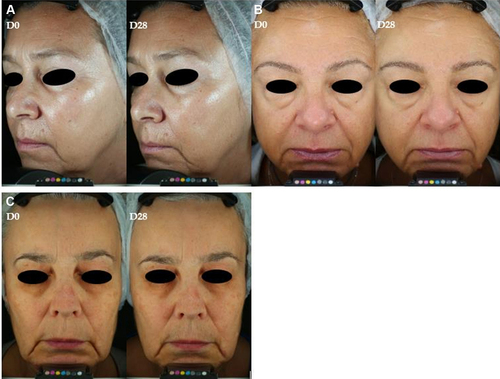
Table 3 Secondary Endpoint Results
Table 4 Self-Assessment Questionnaire Output. Data are the Percentage of Subjects Giving a Particular Answer