Figures & data
Figure 1 Preoperative photograph of the patient.
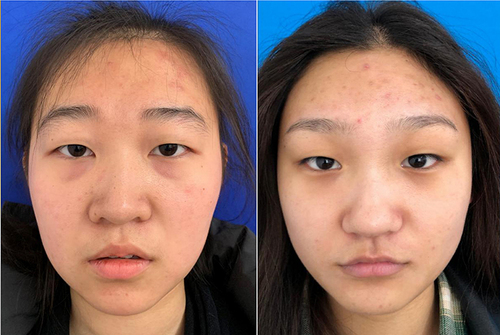
Table 1 Landmarks Used for Brow Positional Analysis
Figure 2 Medial canthus to medial canthus is measured as X; medial canthus to ipsilateral cheek apex is measured as Y = 1.618x. The distance between the upper edge of the eyebrow and the edge of the lower eyelid (a) and the distance between the edge of the lower eyelid and the nasal base (b) were measured.
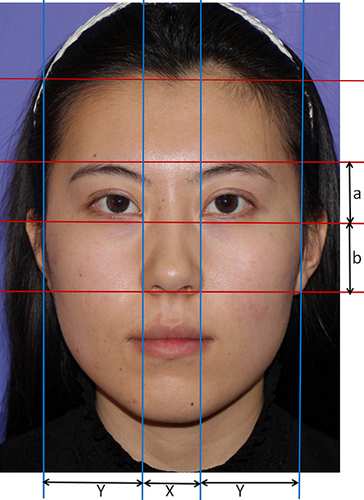
Figure 3 (A and B) both show the changes in the eyebrow shape before and after surgery. Before the operation (Left). Three months after external incision upper eyelidplasty (Right). The indicators of H1~H6 are shown in .
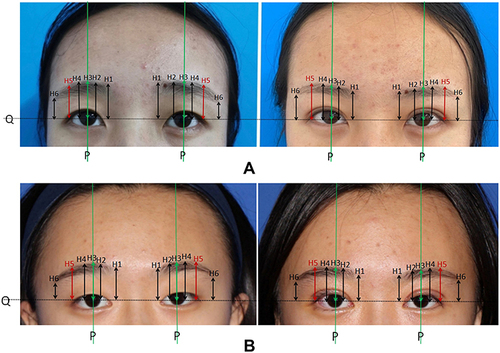
Figure 4 Graphical plots of the changes in the landmark data before and after surgery. The change in the position of the brows shown in. can be clearly seen in .
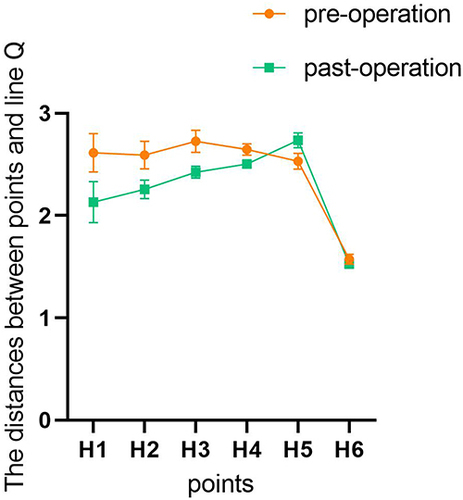
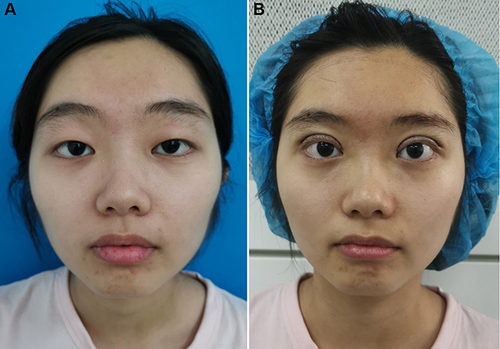
Figure 5 The overall changes before and after surgery Case 1. (A) Before the operation. (B) Two months after upper eyelidplasty.
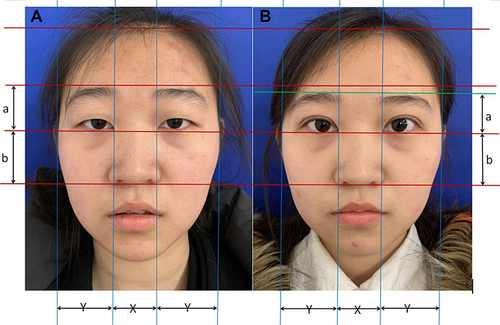
Figure 6 The overall changes before and after surgery Case 2. (A) Before the operation. (B) Six months after upper eyelidplasty.
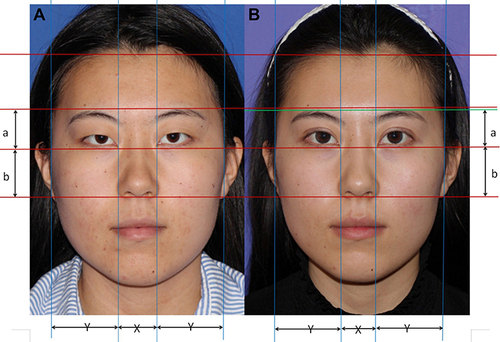
Table 2 Periorbital Area Measurements
Figure 7 The bar chart of the average variation in facial proportion before and after surgery. Data are represented as mean ± SD. n = 3. *P < 0.05, ****P < 0.0001.
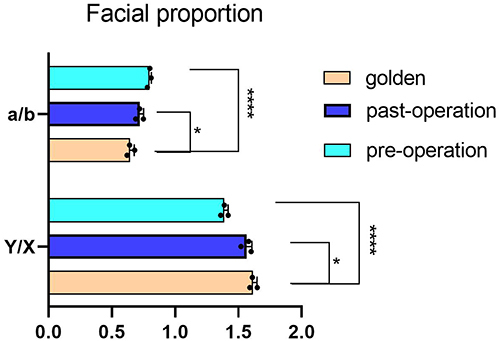
Figure 8 (A) Photograph of the patient who was not satisfied with her appearance. (B) At the end of 6 months post-operation, the patient was satisfied with the results and became more confident.
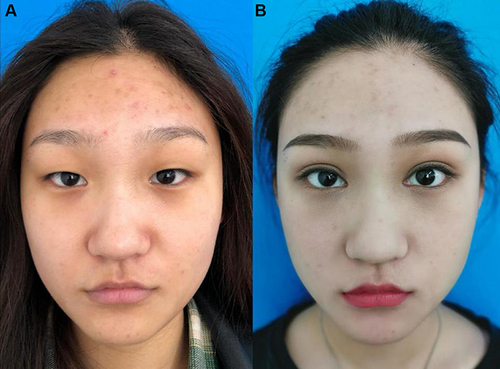
Figure 9 (A) Photograph of the patient who looked exhausted before surgery. (B) Immediately after surgery, her MRD1 had significantly increased, her forehead was larger, eyebrows were lower, and facial proportions became more harmonious. She looked more attractive and alert after the operation.