Figures & data
Figure 1 Psoriatic skin differs from adjacent skin in both appearance and histopathology. (A) The appearance of psoriasis patient; (B) Histopathology of psoriasis skin; (C) Histopathology of adjacent normal skin in psoriasis patient.
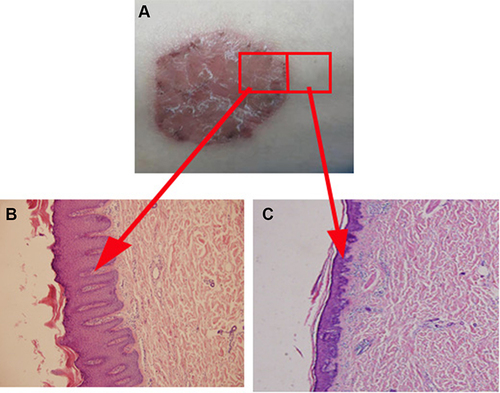
Figure 2 Genome-wide profiling of differentially expressed mRNAs. (A) Venn diagram of transcription coding ability prediction. (B) Distribution of exons. (C) Distribution of transcript length. (D) Histogram of transcription levels. (E) Volcano plot of differentially expressed mRNAs between psoriatic lesions (PL) and adjacent normal skin (NL).
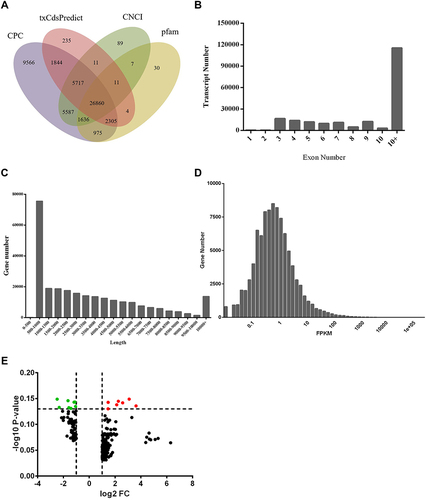
Figure 3 Gene Ontology (GO) and KEGG analysis of target genes. (A) GO biological process analysis. (B) GO cellular component analysis. (C) KEGG pathway analysis.
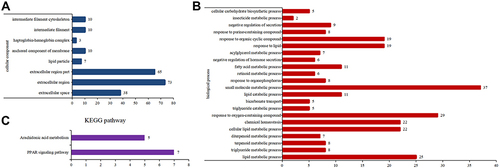
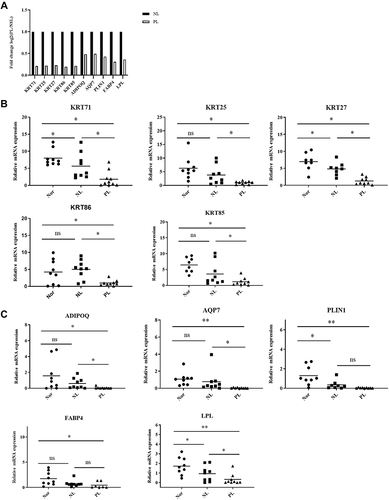
Figure 4 RT-qPCR of target gene expression levels. (A) The expression levels of PPAR pathway genes and intermediate filament cytoskeleton genes by RNA-seq. (B) The relative expression of PPAR pathway genes were analysis using RT-qPCR. (C) The relative expression of intermediate filament cytoskeleton genes were analysis using RT-qPCR. Data are expressed as the mean ± standard deviation. Comparisons between two groups were performed using Student’s t-tests. *P<0.05, **P<0.01.