Figures & data
Table 1 Main Demographic and Clinical Data of the Participants (n = 20)
Figure 1 Sequential visits (previous to 180 days) from a participant who received 23 units of IncobotulinumtoxinA on the glabella. Photos under maximum contraction.
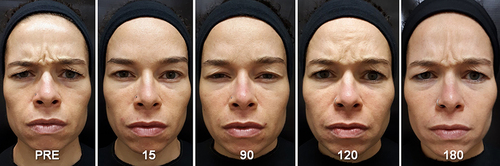
Figure 2 Sequential visits (previous to 180 days) from a participant who received 22 units of IncobotulinumtoxinA on the forehead. Photos under maximum contraction.
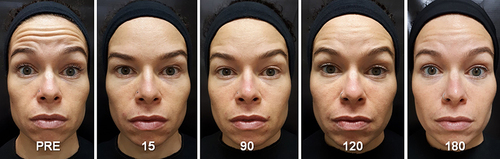
Figure 3 Sequential visits (previous to 180 days) from a participant who received 44 units of IncobotulinumtoxinA on the forehead. Photos under maximum contraction.

Figure 4 MAS scores of dynamic lines of the forehead at D0, D15, D90, D120, and D180 (n = 20).
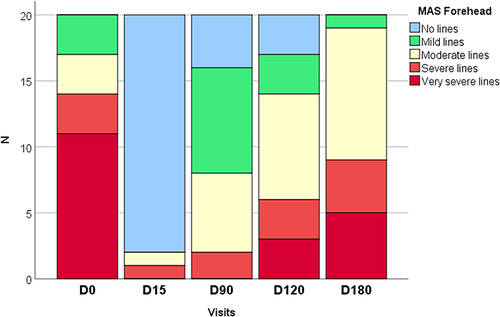
Figure 5 MAS scores of dynamic lines of the glabella at D0, D15, D90, D120, and D180 (n = 20).
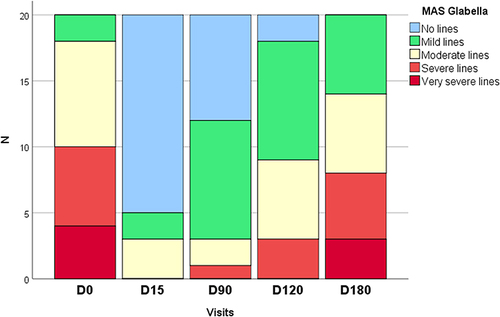
Figure 6 Percent (95% CI) of participants with any improvement in forehead MAS dynamic lines severity, according to the visits (n = 20).
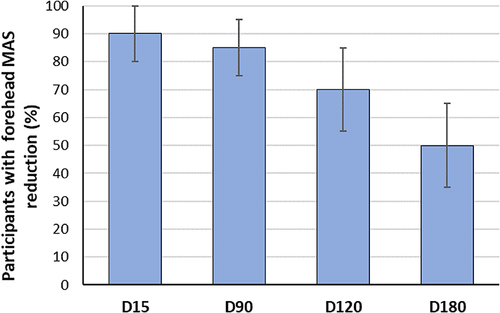
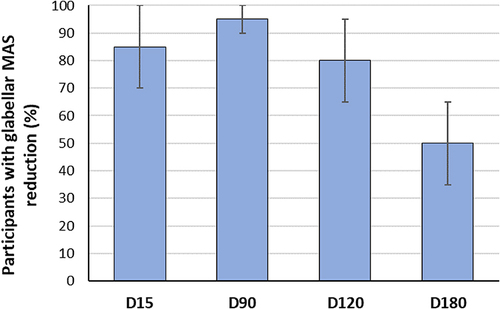
Figure 7 Percent (95% CI) of participants with any improvement in glabellar MAS dynamic lines severity, according to the visits (n = 20).