
Figures & data
Table 1 Feed Composition and Nutrient Level
Figure 1 Comparison of feed intake of rats.
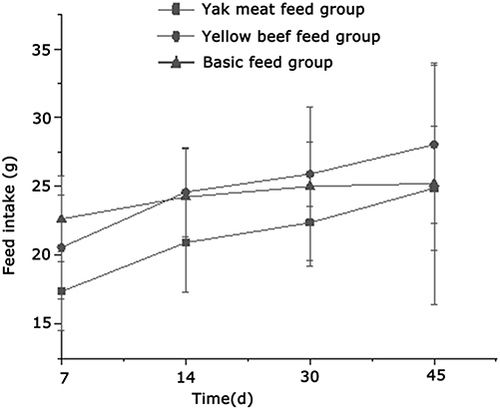
Figure 2 Comparison of body weight of rats.
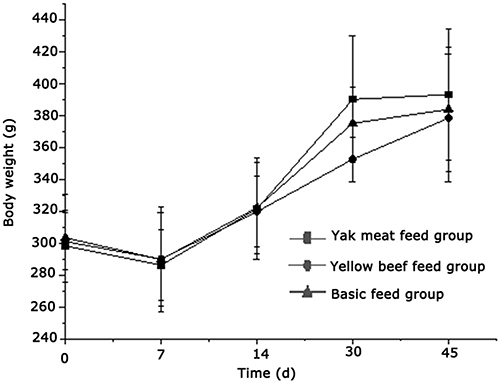
Table 2 Lee’s Index Added in Different Diets for Scald Rats
Figure 3 Comparison of obesity index in rats.
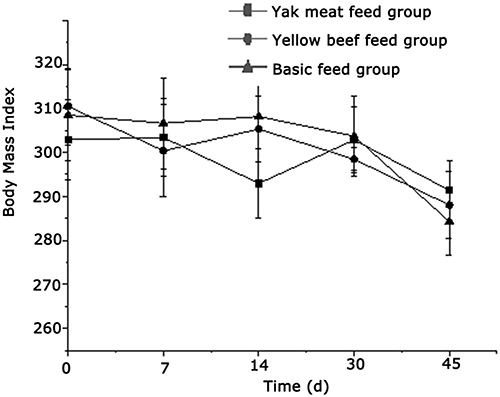
Figure 4 (a) Wound condition of rats in each group on the first day after scald. (b) Wound status of rats in each group on the 7th day after scald. (c)Wound status of rats in each group on the 14th day after scald. (d) Wound condition of rats in each group on day 21 after scald. (e) Wound condition of rats in each group on the 30th day after scald.
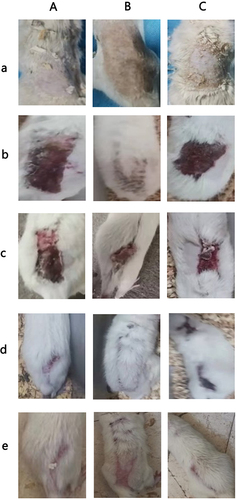
Figure 5 (a) He staining status of rats in each group at 7 days after scald. (b) He staining of rats in each group 14 days after scald. (c) He staining of rats in each group at 30 days after scald. (d) He staining status of rats in each group 45 days after scald.
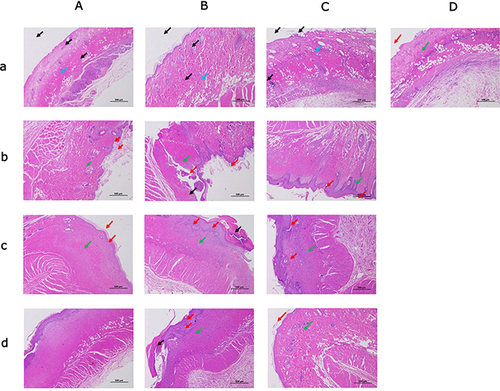
Figure 6 (a) Condition of rats in each group at 7th PCNA day after scald. (b). Conditions of rats in each group at the 14th PCNA day after scald. (c). Condition of rats in each group on day 30th PCNA after scald. (d) Condition of rats in each group on 45th PCNA after scald.
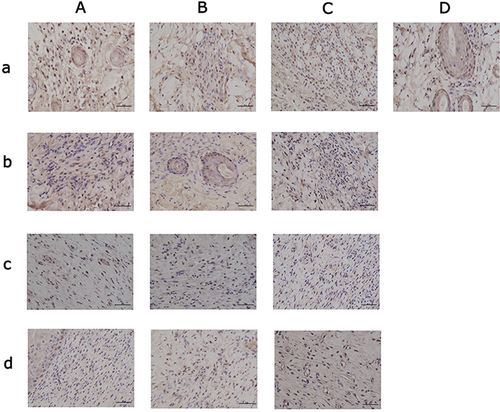
Table 3 PCNA Positive Cell Rate (%)
Figure 7 (a) Apoptosis of rats in each group on the 7th day after scald. (b) Apoptosis of rats in each group on the 14th day after scald. (c) Apoptosis of rats in each group on the 30th day after scald. (d) Apoptosis of rats in each group on the 45th day after scald.
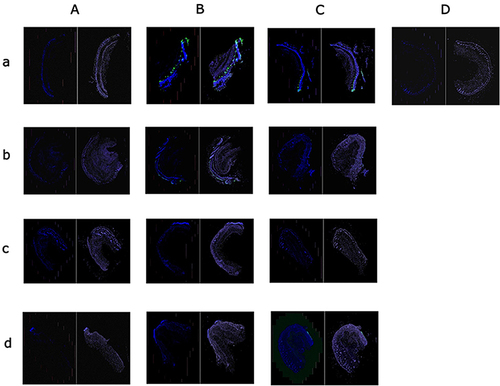
Table 4 Positive Cell Ratio and Positive Area Ratio of Scald Rats in Different Groups
Table 5 Comparison of Positive Cell Density, Average Optical Density and Positive Surface Density of Scald Rats in Different Feed Groups