Figures & data
Table 1 Information of Volunteers with Psoriasis Vulgaris
Table 2 Primer Information
Figure 1 ITGA9 expression is downregulated in psoriatic HDMECs. (A) Cell morphology of primary psoriatic and normal HDMECs. Scale bar =100 μm. (B) Relative expression levels of ITGA9 mRNA analyzed by qRT-PCR. ***P < 0.001. (C and D) Expression levels of ITGA9 protein by Western blot. Expression levels were normalized to β-actin. **P < 0.01. N= 6 for all.
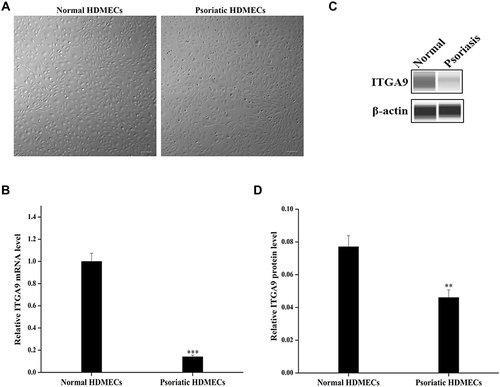
Figure 2 ITGA9 overexpression inhibits cell proliferation and migration, while increases apoptosis in HMEC-1 cultures. (A) Cell morphology of human microvascular endothelial cell line (HMEC-1). Scale bar =100 μm. (B) Relative expression levels of ITGA9 mRNA after pLVX-ITGA9 transfection. ***P < 0.001. (C and D) ITGA9 protein levels after pLVX-ITGA9 transfection. Expression levels of ITGA9 protein were normalized to β-actin. ***P < 0.001. (E) The cell viability of survival HMEC-1 cells assessed by CCK-8 assay after pLVX-ITGA9 transfection daily over a 96-h period. ***P < 0.001. (F and G) The percentage of EDU-positive cells after pLVX-ITGA9 transfection. **P < 0.01. Blue: nuclear staining with Hoechst. Red: EdU, 5-ethynyl-2′-deoxyuridine. Scale bar =100 μm. (H and I) The cell apoptosis assessed by Annexin V-FITC/PI apoptosis detection kit after pLVX-ITGA9 transfection. *P < 0.05. FITC, fluorescein isothiocyanate. PI, propidium iodide. (J and K) The percentage of wound closure rate assessed respectively at 0h and 24h by wound healing assay after pLVX-ITGA9 transfection. **P < 0.01. (L and M) The numbers of migrated HMEC-1 after pLVX-ITGA9 transfection. **P < 0.01. N= 6 for all.
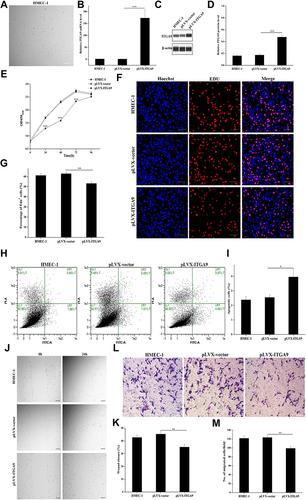
Figure 3 miR-146a-3p directly targets ITGA9, resulting in stimulation of cell proliferation and migration, and inhibition of apoptosis in HMEC-1 cultures. (A) Using the TargetScan software, we predicted that the seed sequence of miR-146a-3p matches the ITGA9 3’-UTR from 3256 to 3263 nucleotides, and identified ITGA9 gene as the potential target of miR-146a-3p. (B) Relative expression levels of miR-146a-3p. ***P < 0.001. (C) Correlation of miR-146a-3p and ITGA9 expression in HDMECs (R2=0.9120, P < 0.01). (D) Relative expression levels of miR-146a-3p after miR-146a-3p-mimic transfection. ***P < 0.001. (E) Relative expression levels of ITGA9 after miR-146a-3p-mimic transfection. *P < 0.05. (F and G) Expression levels of ITGA9 protein after miR-146a-3p-mimic transfection examined by Western blot. Expression levels of ITGA9 protein were normalized to β-actin. ***P < 0.001. (H) The cell viability of survival HMEC-1 cells assessed by CCK-8 assay after miR-146a-3p-mimic transfection daily over a 96-h period. *P < 0.05; ***P < 0.001. (I and J) The percentage of EDU-positive cells after miR-146a-3p-mimic transfection. *P < 0.05. Blue: nuclear staining with Hoechst. Red: EdU, 5-ethynyl-2′-deoxyuridine. Scale bar =100 μm. (K and L) The cell apoptosis assessed by Annexin V-FITC/PI apoptosis detection kit after miR-146a-3p-mimic transfection. *P < 0.05. FITC, fluorescein isothiocyanate. PI, propidium iodide. (M and N) The percentage of wound closure rate assessed respectively at 0h and 24h by wound healing assay after miR-146a-3p-mimic transfection. **P < 0.01. (O and P) The number of migrated HMEC-1 after miR-146a-3p-mimic transfection. **P < 0.01. N= 6 for all.
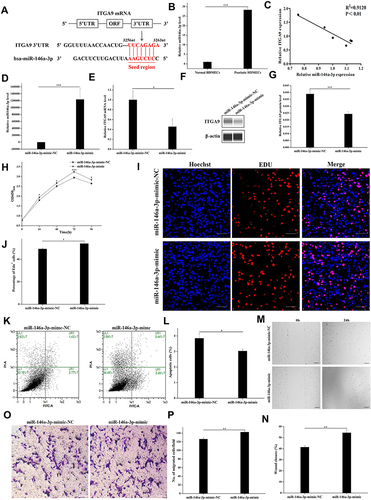
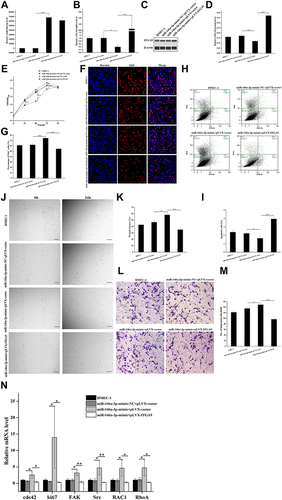
Figure 4 Restoration of ITGA9 expression reverses the increased cell proliferation and migration, and decreased apoptosis in HMEC-1 transfected with miR-146a-3p. (A) Relative expression levels of miR-146a-3p miRNA after miR-146a-3p-mimic+pLVX-vector transfection and miR-146a-3p-mimic+pLVX-ITGA9 transfection analyzed by miqRT-PCR. ***P < 0.001. (B) Relative mRNA expression level of ITGA9 after miR-146a-3p-mimic+pLVX-vector transfection and miR-146a-3p-mimic+pLVX-ITGA9 transfection analyzed by qRT-PCR. *P < 0.05; **P < 0.01. (C and D) Expression levels of ITGA9 protein after miR-146a-3p-mimic+pLVX-vector transfection and miR-146a-3p-mimic+pLVX-ITGA9 transfection examined by Western blot. Expression levels of ITGA9 protein were normalized to β-actin. **P < 0.01; ***P < 0.001. (E) The cell viability of survival HMEC-1 cells assessed by CCK-8 assay after miR-146a-3p-mimic+pLVX-vector transfection and miR-146a-3p-mimic+pLVX-ITGA9 transfection daily over a 96-h period. *P < 0.05; ***P < 0.001. (F and G) The percentage of EDU-positive cells after miR-146a-3p-mimic+pLVX-vector transfection and miR-146a-3p-mimic+pLVX-ITGA9 transfection. Blue: nuclear staining with Hoechst. Red: EdU, 5-ethynyl-2′-deoxyuridine. Scale bar =100 μm. ***P < 0.001. (H and I) The cell apoptosis assessed by Annexin V-FITC/PI apoptosis detection kit after miR-146a-3p-mimic+pLVX-vector transfection and miR-146a-3p-mimic+pLVX-ITGA9 transfection. FITC, fluorescein isothiocyanate. PI, propidium iodide. *P < 0.05; ***P < 0.001. (J and K) The percentage of wound closure rate assessed respectively at 0h and 24h by wound healing assay after miR-146a-3p-mimic+pLVX-vector transfection and miR-146a-3p-mimic+pLVX-ITGA9 transfection. *P < 0.05; ***P < 0.001. (L and M) The number of migrated HMEC-1 after miR-146a-3p-mimic transfection. *P < 0.05; ***P < 0.001. (N) Relative expression levels of mRNA for cdc42, ki67, FAK, Src, RAC1 and RhoA after miR-146a-3p-mimic+pLVX-vector transfection and miR-146a-3p-mimic+pLVX-ITGA9 transfection analyzed by qRT-PCR. *P < 0.05; **P < 0.01. N=6 for all.