Figures & data
Table 1 Experimental Parameters for 1- and 2-MHz Invasive Bipolar Radiofrequency (RF) Treatment on ex vivo Bovine Liver Tissue
Table 2 Factors Associated with Thermometric Values After 1- and 2-MHz Invasive Bipolar RF Treatments on ex vivo Bovine Liver Tissue in Univariate and Multivariate Linear Regression Analysis
Figure 1 Thermal imaging camera study. Images were captured at baseline, immediately, and 10s after bipolar radiofrequency (RF) treatment at a frequency of 1 MHz. The experimental settings were (A) a power of 4W, a conduction time/pulse pack of 200 msec, and a single pulse pack; (B) 12W, a conduction time/pulse pack of 200 msec, and a single pulse pack; (C) 12W, a conduction time/pulse pack of 600 msec, and a single pulse pack; (D) 12W, a conduction time/pulse pack of 100 msec, 2 pulse packs, an off-time between pulse packs of 50 msec, and a total conduction time of 200 msec; and (E) 12W, a conduction time/pulse pack of 100 msec, two pulse packs, an off-time between pulse packs of 20 msec, and a total conduction time of 200 msec. The thermometric values of baseline tissue were adjusted to 36°C.
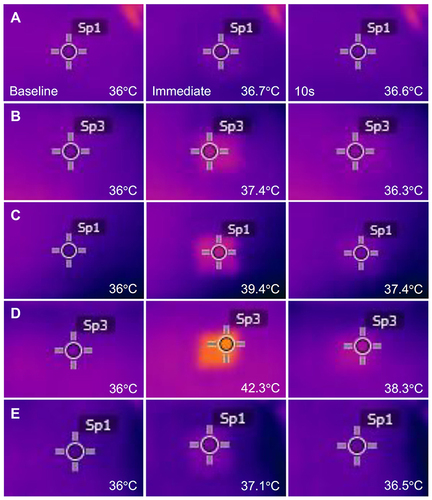
Table 3 Factors Associated with Thermometric Values After 1-MHz Invasive Bipolar RF Treatment on ex vivo Bovine Liver Tissue in Univariate and Multivariate Linear Regression Analysis
Figure 2 Thermal imaging camera study. Images were captured at baseline, immediately, and 10s after bipolar RF treatment at a frequency of 2 MHz. The experimental settings were (A) a power of 4W, a conduction time/pulse pack of 200 msec, and a single pulse pack; (B) 12W, a conduction time/pulse pack of 200 msec, and a single pulse pack; (C) 12W, a conduction time/pulse pack of 600 msec, and a single pulse pack; (D) 12W, a conduction time/pulse pack of 100 msec, two pulse packs, an off-time between pulse packs of 50 msec, and a total conduction time of 200 msec; and (E) 12W, a conduction time/pulse pack of 100 msec, two pulse packs, an off-time between pulse packs of 20 msec, and a total conduction time of 200 msec. The thermometric values of baseline tissue were adjusted to 36°C.
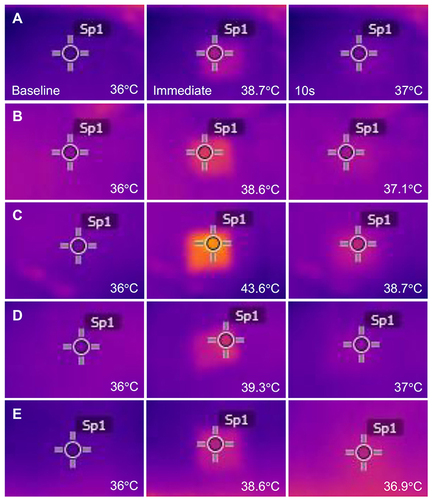
Table 4 Factors Associated with Thermometric Values After 2-MHz Invasive Bipolar RF Treatment on ex vivo Bovine Liver Tissue in Univariate and Multivariate Linear Regression Analysis
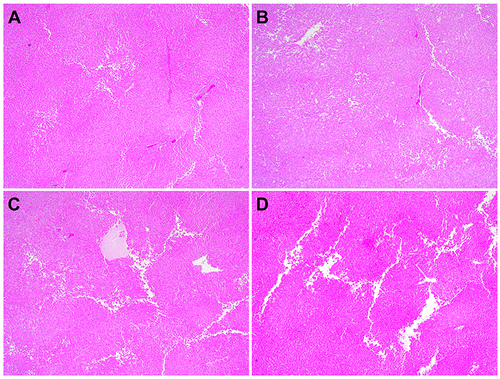
Figure 3 Tissue reactions after 1-MHz bipolar RF treatment on ex vivo bovine liver tissue. The ex vivo bovine liver tissue was treated at experimental settings of (A and B) 12W, a conduction time/pulse pack of 100 msec, three pulse packs, an off-time between pulse packs of 50 msec, and a total conduction time of 300 msec and (C and D) 12W, a conduction time/pulse pack of 100 msec, three pulse packs, an off-time between pulse packs of 20 msec, and a total conduction time of 300 msec. The superficial (A and C) and deeper (B and D) parts of liver tissue specimens exhibit RF-induced tissue reactions at the proximal and distal parts of invasive microneedles, respectively. Hematoxylin & eosin stain. Original magnification x40.
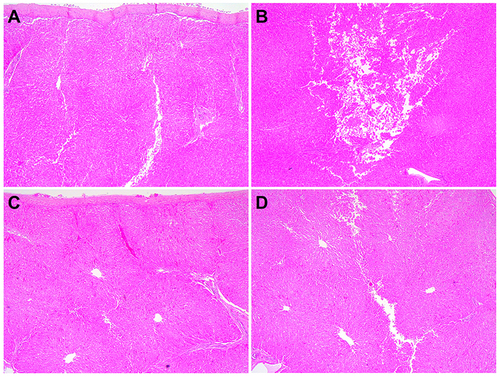
Figure 4 Tissue reactions after 2-MHz bipolar RF treatment on ex vivo bovine liver tissue. The ex vivo bovine liver tissue was treated at experimental settings of (A) 12W, a conduction time/pulse pack of 300 msec, and a single pulse pack; (B) 12W, a conduction time/pulse pack of 400 msec, and a single pulse pack; (C) 12W, a conduction time/pulse pack of 100 msec, three pulse packs, an off-time between pulse packs of 50 msec, and a total conduction time of 300 msec; and (D) 12W, a conduction time/pulse pack of 100 msec, three pulse packs, an off-time between pulse packs of 20 msec, and a total conduction time of 300 msec. Hematoxylin & eosin stain. Original magnification x40.