Figures & data
Figure 1 Human terminal hair follicle. (A) Light microscopy image of a longitudinal section showing the hair follicle infundibulum and the hair shaft. The infundibulum is filled with cell debris and sebum. Insets (b–d) are regions of the hair follicle that were observed by means of transmission electron microscopy (B, C and D respectively), using an ultrafine section prepared from the same sample block. (B) The SC in the apical part of the hair follicle orifice consists of several corneocytes layers. Bacteria colonies are visible as well. (C) The SC in the hair follicle infundibulum is thinner than the SC in the upper part of the hair follicle orifice and in the inter-follicular epidermis. (D) Image of the hair shaft and the inner root sheath.
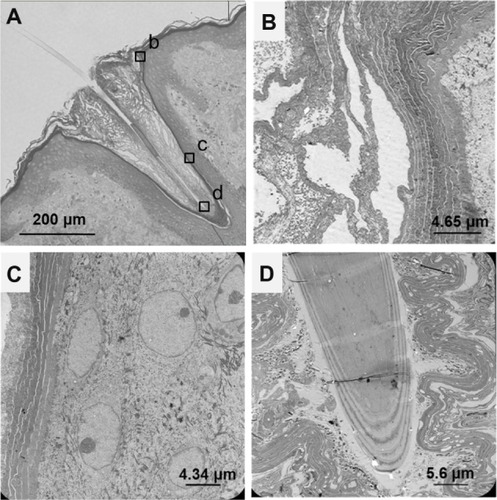
Figure 2 Skin penetration of polymeric carriers and drug release in (A) healthy skin and (B) hypothesis of polymer particle behavior in diseased skin.
Abbreviation: SC, stratum corneum.
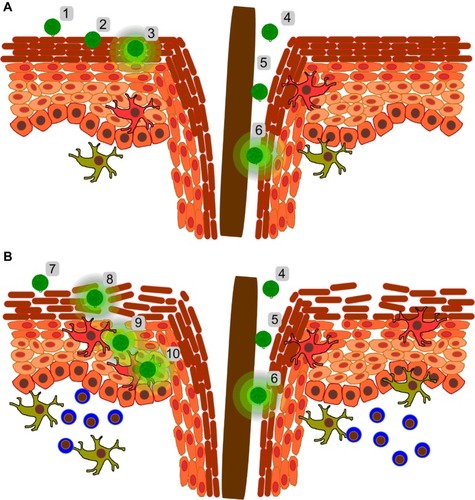
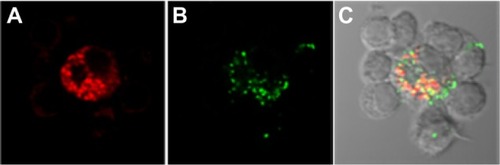
Figure 3 Confocal fluorescence images showing the uptake of Escherichia coli particles and polystyrene particles (200 nm) by dendritic cells (unpublished data). Dendritic cells derived from peripheral blood mononuclear cells were co-cultured with T-cells and incubated with inactivated E. coli particles labeled with a pH sensitive dye that becomes fluorescent in an acidic environment (A; red) and FITC-loaded 200 nm polystyrene particles (B, green). The overlay image (C) shows that the bigger cells (ie, dendritic cells), but not T-cells, had internalized particles. Both E. coli and polystyrene particles were co-localized in intracellular acidic compartments.