
Figures & data
Table 1 Characteristic of Patients with Androgenetic Alopecia and Healthy Controls
Table 2 Serum Concentrations of Leptin, Adiponectin, Adpn/Lep Ratio, Resistin, Visfatin, 25(OH)D, Insulin and HOMA-IR in Patients with AGA and Healthy Controls
Figure 1 Serum concentrations of leptin, Adpn/Lep ratio and 25(OH)D in patients with AGA and healthy controls. (a) In compare to healthy group, AGA patients showed higher leptin level. (b) In compare to healthy group, AGA patients showed lower Adpn/Lep ratio. (c) In compare to healthy group, AGA patients showed lower 25(OH)D level. *Indicates statistically significant difference, p value<0.05; **Indicates statistically significant difference, p value<0.01.
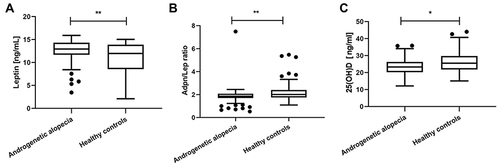
Figure 2 Serum concentrations of leptin and Adpn/Lep ratio in patients with mild, moderate and severe AGA. (a) There were large differences in serum leptin level both between moderate AGA versus healthy group and mild AGA, and between severe AGA versus healthy group and mild AGA, while moderate versus severe AGA showed no significant difference. (b) There were large differences in Adpn/Lep ratio both between moderate AGA versus healthy group and mild AGA, and between severe AGA versus healthy group and mild AGA, while moderate versus severe AGA showed no significant difference. **Indicates statistically significant difference, p value<0.01, ***Indicates statistically significant difference, p value<0.001.
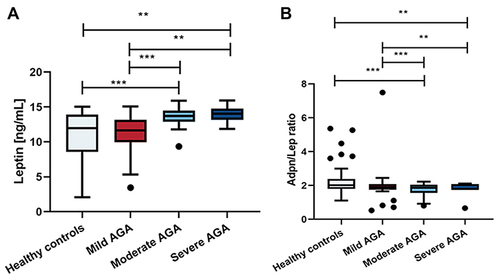
Figure 3 (a) AGA IR group versus healthy IR group, AGA IR group possessed a lower Adpn/Lep ratio. (b) AGA NIR group versus healthy NIR group, AGA NIR group showed a lower Adpn/Lep ratio. *Indicates statistically significant difference, p value<0.05.
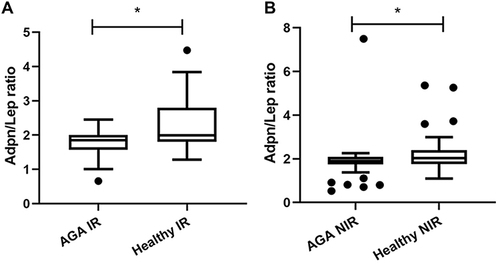
Table 3 The Association of Insulin Resistance, Age, BMI, 25(OH)D and Adpn/Lep Ratio with the Development of Androgenetic Alopecia by Multivariate Analysis
Table 4 The Association of Insulin Resistance, Age, BMI, 25(OH)D and Leptin with the Development of Androgenetic Alopecia by Multivariate Analysis