
Figures & data
Table 1 Characteristics of the Subjects Included in the Study
Table 2 Descriptive Statistics, Evolution Across Time (D28-D0) and Treatment (Side) Comparison for Parameters Evaluated by the Investigator
Table 3 Descriptive Statistics, Evolution Across Time (D28-D7) and Treatment (Side) Comparison for the Responses from Self-Assessment Questionnaire
Table 4 Descriptive Statistics, Evolution Across Time (D28-D0) and Treatment (Side) Comparison for Corneometer® Readings
Table 5 Descriptive Statistics and Evolution Across Time (D84-D0) for Parameters Evaluated by the Investigator
Table 6 Descriptive Statistics and Evolution Across Time for the Responses from Self-Assessment Questionnaire
Figure 1 Corneometer® readings evaluated on D0, D7, D28 and D84. Error bars: 95% CI (confidence interval).
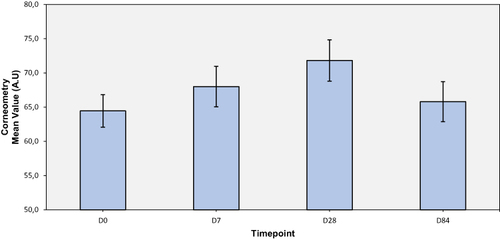
Figure 2 DLQI (Dermatology Life Quality Index) evaluated on D0, D7, D28 and D84. Error bars: 95% CI (confidence interval). A decrease of 41.7% was reported at D28 compared to D0 and a decrease of 47.2% was reported between D84 and baseline (non-significant).
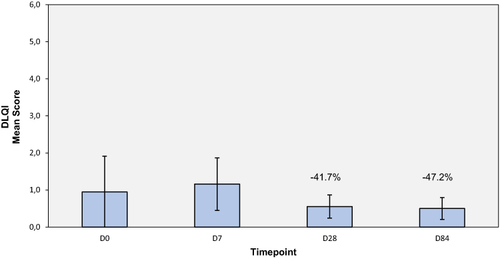
Figure 3 Skindex 16 questionnaire evaluated on D0, D7, D28 and D84. Comparison with baseline. Symptoms are denoted in purple, emotions are pictured in orange and function domain is represented in blue. Error bars: 95% CI (confidence interval); *represents p value ≤0.050, **represents p-value ≤0.010 and ***represents p-value ≤0.001.
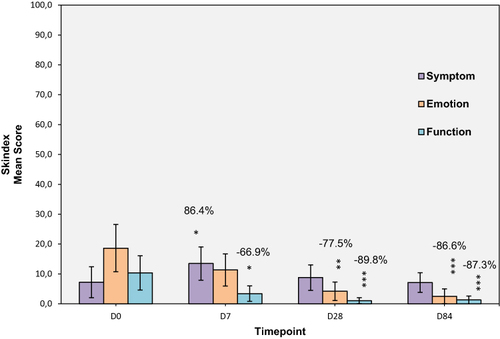
Table 7 Descriptive Statistics, Evolution Across Time (D28-D0) and Treatment (Side) Comparison for the Inflammatory and Oxidative Markers; Pg/Mg Protein: Picogram per Milligram of Protein; UI/Mg Prot: United Inch per Milligram of Protein
Table 8 Descriptive Statistics and Evolution Across Time (D84-D0) for the Inflammatory and Oxidative Markers; Pg/Mg Protein: Picogram per Milligram of Protein; UI/Mg Prot: United Inch per Milligram of Protein