
Figures & data
Table 1 Subject Demographics
Table 2 Injection Volumes
Figure 1 Ease of injection of RHA 4 into the nasolabial fold with a cannula or a needle, according to the treating investigator.
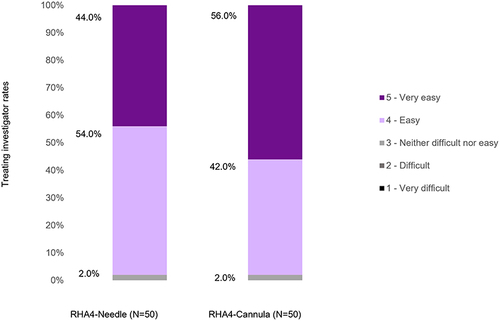
Figure 2 Mean (SD) scores on the 5-point Wrinkle Severity Rating Scale for the nasolabial folds, according to the treating investigator at each visit.
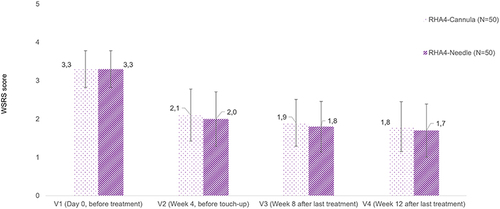
Figure 3 Percentage of subjects who responded to the treatment at each visit, based on changes on the Wrinkle Severity Rating Scale as assessed by the treating investigator.
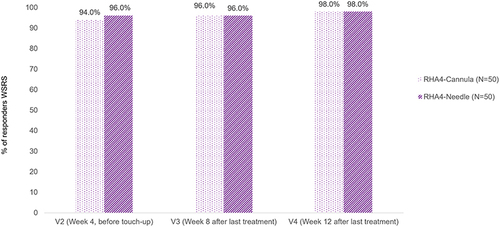
Figure 4 Percentage of subjects rated “improved” or “much improved” on the Global Aesthetic Improvement Scale at each visit by the treating investigator (A) and the subjects (B).
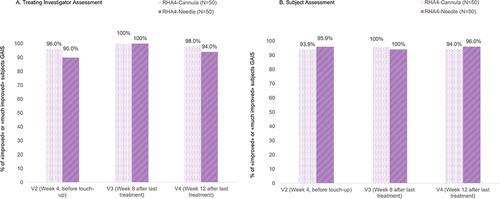
Figure 5 Percentage of subjects “satisfied” or “very satisfied” with the study treatment at each visit.
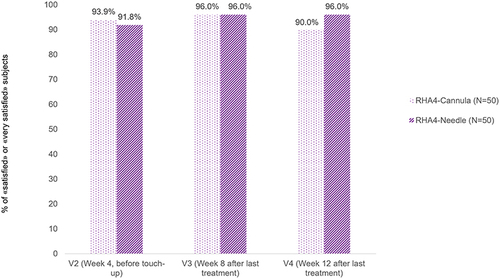
Figure 6 Mean (SD) scores on the nasolabial fold domain of FACE-Q at each visit.
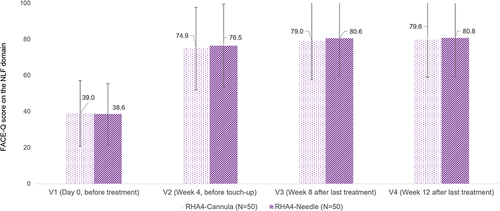
Figure 7 Mean (SD) injection site pain during and after the treatment, as indicated on a 100 mm Visual Analogue Scale.
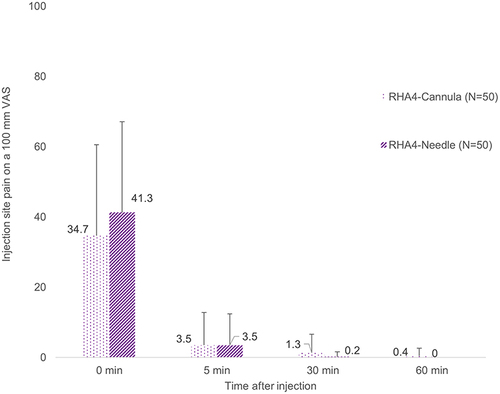
Table 3 Number and Duration of Common Treatment Reactions (CTRs) Based on the Subjects’ 28-Day Diaries That Started at the Initial Treatment
Table 4 Treatment-Related Adverse Events (TRAEs) According to the Technique Used and Overall