
Figures & data
Figure 1 Participant flow chart at each visit. A flow chart showing the activities carried out on each visit during the study. Open arrows: baseline, grey arrows: Week 5 and black arrows represent week 10.
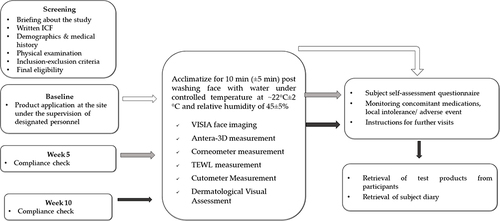
Table 1 Baseline Demographics
Figure 2 Consort diagram.
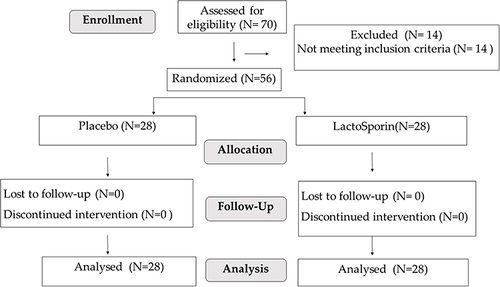
Table 2 Dermatological Assessment of Facial Skin for Signs of Ageing
Table 3 Instrument Analysis of Facial Skin for Signs of Ageing
Figure 3 Analysis of topographical features of the skin by Antera 3D. Representative images from Antera 3D, showing the changes in crow’s feet, under-eye fine lines, nasolabial folds, and forehead fine lines in placebo and LactoSporin at baseline, week 5 and week 10. The blue marks represent wrinkles within the area of interest. A lower value indicates less severity and an improvement.
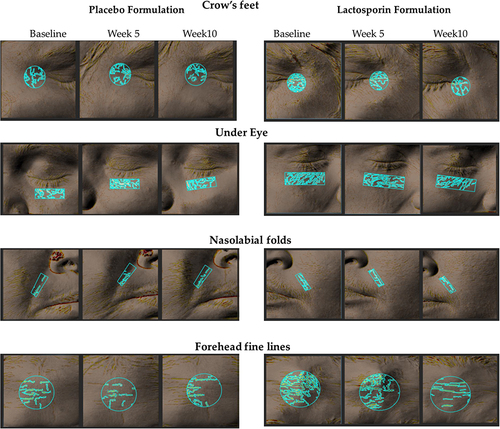
Figure 4 VISIA representative images. Representative VISIA images of two participants each from A -LactoSporin and B- Placebo group taken at baseline, week 5 and week 10. Full face digital images were taken using VISIA-CR Blue 4.3 Camera Imaging System on day 0, day 35 and at day 70 for all the participants. The representative VISIA images of two participants each from LactoSporin (A)and Placebo (B) taken at day 01, day 35 and day 70 are depicted.
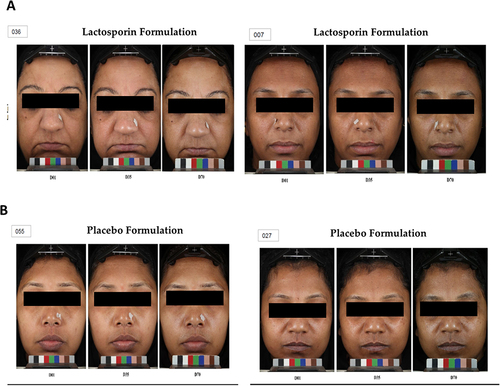
Table 4 Participant Response to Self-Assessment Questionnaire