Figures & data
Figure 1 Study subjects with a pre-treatment MFVDS grade of 3, 4, and 5 respectively, as evaluated by the physician investigator.
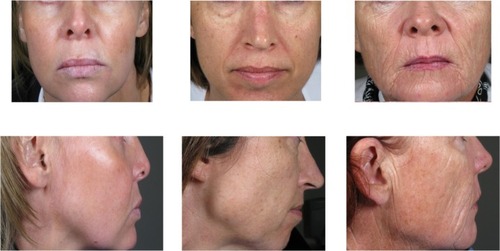
Table 1 Reasons for withdrawal from the study
Figure 2 Study subject with a pre-treatment MFVDS grade of 4 who maintained a ≥1 grade improvement from baseline/pre-treatment state for the duration of the 104 week study after Voluma™ treatment at weeks 0 and 4 only, as evaluated using the MFVDS (physician investigator assessment) and the GAIS (independent physician investigator and subject evaluations).
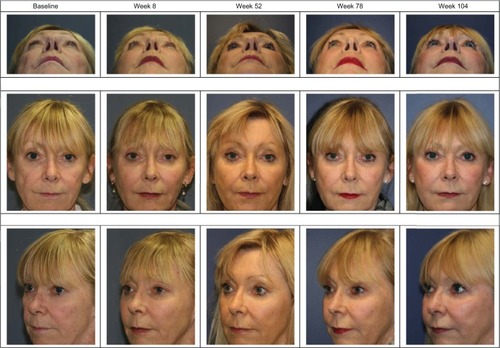
Figure 3 (A) Proportion of subject with ≥1 point improvement from baseline in MFVDS score, (“MFVDS responder”) as evaluated by the physician investigators (all subjects). No subject received further study treatment after week 0 or 4. Numbers in parentheses are the sample size at each visit. (B) Proportion of responders from the sub-group of 45 subjects who completed the study and who received no further treatment with the study product after the week 0 or 4.
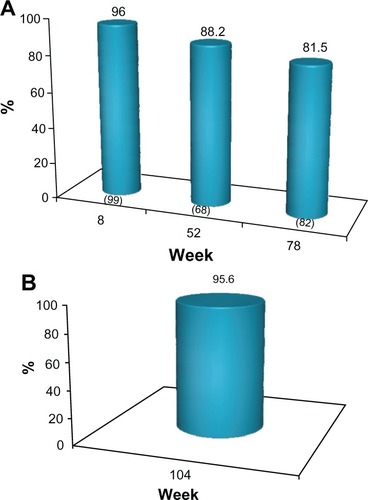
Table 2 Proportion of subjects with maintenance of a clinically meaningful correction of their midface volume deficiency during the study, based on physician MFVDS and physician and subject GAIS scoresTable Footnotea,Table Footnoteb
Figure 4 (A) Proportion of subjects with ≥1 point improvement in their pre-treatment appearance based on GAIS (“GAIS responder”), as evaluated by the physician investigators. No subject received further study treatment after week 0 or 4. Numbers in parentheses are the sample size at each visit. (B) Proportion of subjects from the subgroup of 45 who completed the study and who received no further treatment after week 0 or 4 with ≥1 point improvement in their pre-treatment appearance, based on the GAIS (“GAIS responder”) at week 104, as evaluated by the physician investigators.
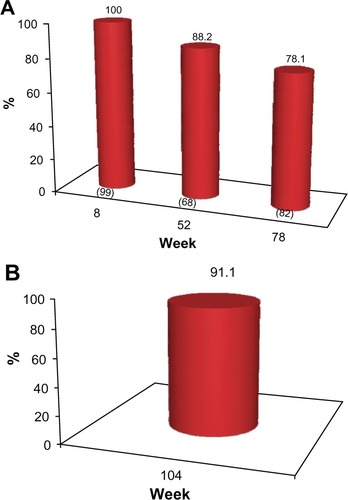
Figure 5 (A) Proportion of subjects with ≥1 point improvement in their pre-treatment appearance based on GAIS (“GAIS responder”), as evaluated by the subjects. No subject received further study treatment after week 0 or 4. Numbers in parentheses are the sample size at each visit. (B) Proportion of subjects from the sub-group of 45 who completed the study and who received no further treatment after week 0 or with a ≥1 point improvement in their pre-treatment appearance, based on the GAIS (“GAIS responder”) at week 104, as self-evaluated by the subjects.
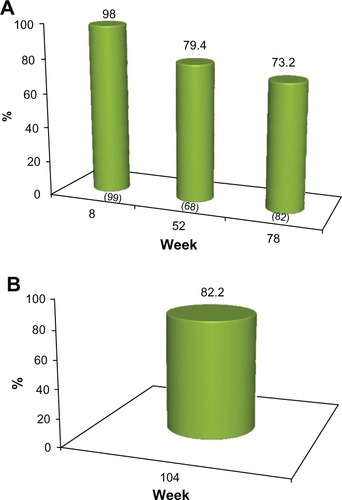
Figure 6 Treatment Satisfaction of the Study Subjects (all observed subjects).
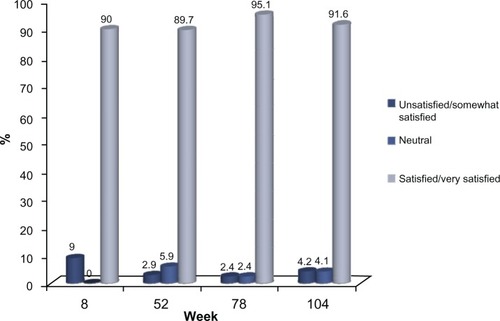
Figure 7 Study Treatment Recommendation.
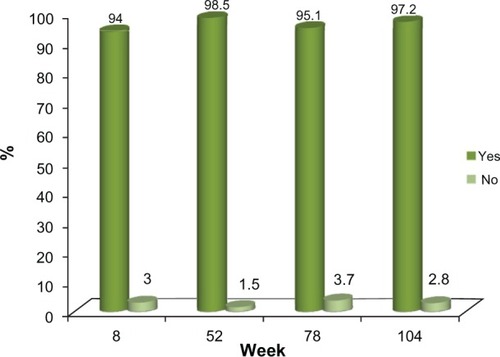
Table 3 Incidence of injection site reactions following the two observational periods (weeks 0–8 and weeks 78–108)