Figures & data
Figure 1 (A) Representative microneedle packaging comes with DMN and sterile saline pad for application, (B) Photograph of DMN, (C) Representative stereomicroscopic images of the 1000 µm DMN-containing triamcinolone acetonide.
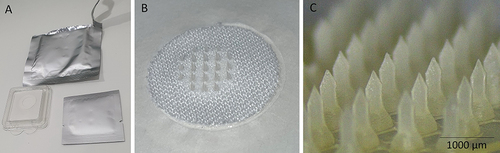
Table 1 Physician Grading
Table 2 Participant Demographic Data and Treatment History
Figure 2 CONSORT diagram. Screening, enrollment, and follow-up of study participants.
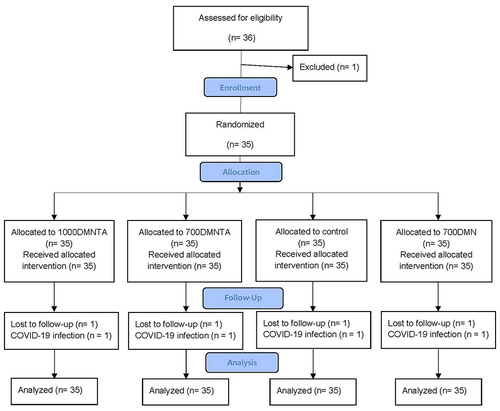
Table 3 Number of Lesions That Achieved Resolution Each Follow-Up Day
Figure 3 Kaplan–Meier curve of time to resolution of inflammatory acne by physician grading.
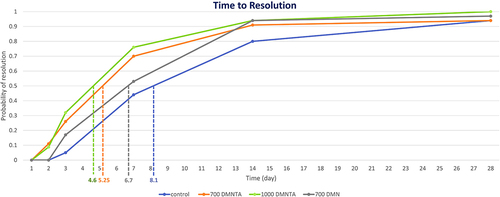
Figure 4 Diameter of inflammatory acne measured by Vernier caliper in millimeter *Significance difference from baseline. **p-value comparing each treatment and control using multi-level data analysis, <0.05 is considered statistically significant.
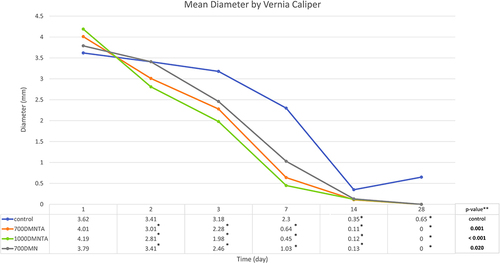
Figure 5 Mean erythema and melanin index of inflammatory acne at days 1 and 28 measured by colorimeter. *p-value comparing each treatment and control using multi-level data analysis, <0.05 is considered statistically significant.
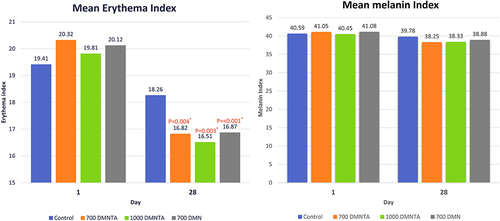
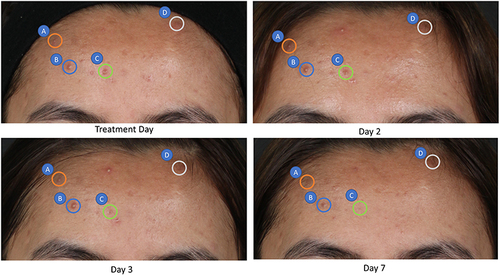
Figure 6 Clinical photographs of subject; (A) 1000DMNTA, (B) 700DMNTA, (C) control, (D) 700DMN.
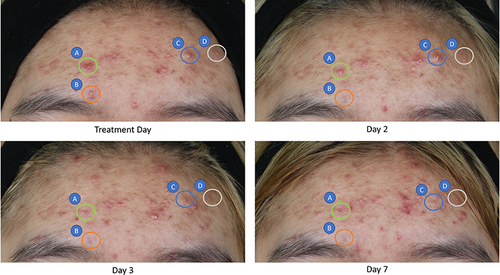
Figure 7 Clinical photographs of subject; (A) 700DMNTA, (B) control, (C) 1000DMNTA, (D) 700DMN.