Figures & data
Figure 1 NaHS suppressed cell proliferation and induced apoptosis of A375 cells. (A) Morphological changes of A375 cells caused by treatment at different concentrations of NaHS (0, 20, and 50 mM). (B) CCK-8 assay at different concentrations of NaHS-treated A375 cells. (C) Hoechst 33258 staining of A375 cells subjected to NaHS (20 mM) exposure and control cells (0 mM). (D) Cytometric analysis of NaHS (20 mM) treated A375 cells and control cells (0 mM). (E) Western blotting analysis of cleaved Caspase-3 and Bcl-XL in NaHS (20 mM) treated A375 cells and control cells (0 mM). **P < 0.01, ***P < 0.001 compared with negative control (NC).
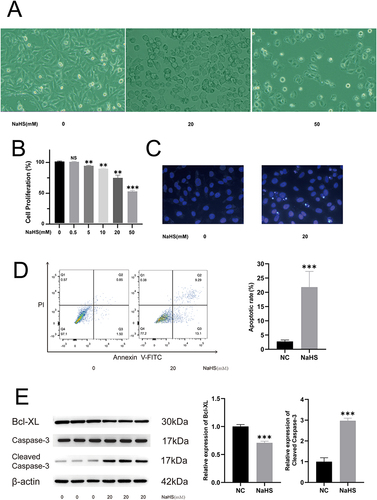
Figure 2 Transcriptional profiles showed increased endoplasmic reticulum stress and unfolded protein response in NaHS-treated A375 cells. (A) Principal-component analysis (PCA) of the samples. (B) Correlation analysis of the samples. (C) Volcano plot of the differential expression of genes between NaHS (20 mM) treated A375 cells and control cells (0 mM). (D) Heat map of the differentially expressed genes (DEGs). (E) GO biological process enrichment analysis of the up-regulated DEGs. (F) KEGG pathway analysis of the up-regulated DEGs. (G) Metascape network showed inter-cluster enriched GO terms for the up-regulated DEGs.
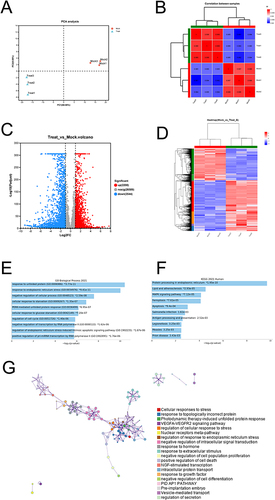
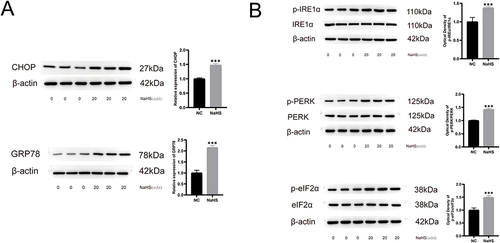
Figure 3 The increased protein expression levels of unfolded proteins response and endoplasmic reticulum stress in NaHS-treated A375 cells. (A) Western blot of CHOP and GRP78 in NaHS (20 mM) treated A375 cells and control cells (0 mM). (B) Western blot of p‐IRE1α, IRE1α protein, p‐PERK, PERK protein, p‐eIF2α, and eIF2α in NaHS (20 mM) treated A375 cells and control cells (0 mM). ***P < 0.001 compared with negative control (NC).