Figures & data
Table 1 Demographic and Clinical Characteristics of the Patients with SSCC
Figure 1 Three types of ICG fluorescence imaging.
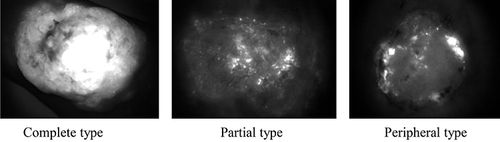
Figure 2 Preoperative ICG fluorescence imaging of a scar cancer of left medial malleolus. (A) The gross appearance; (B) Visible light image under near-infrared imaging; (C) Fluorescence image under preoperative imaging. Red arrows indicate tissues with strong fluorescence signals; (D) The HE staining of the biopsied tumor tissues. The scale bar indicates 100 μm.
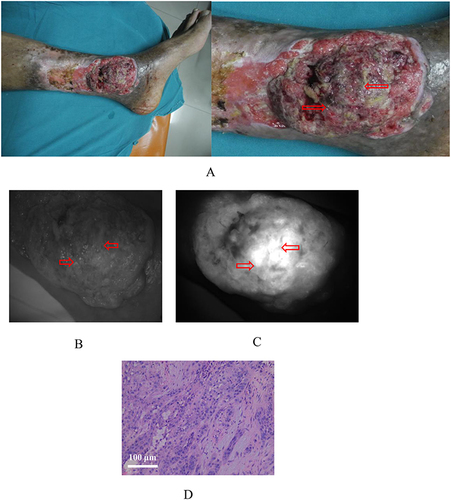
Table 2 Intraoperative Real-Time ICG Fluorescence Imaging (IFI) and Recurrence
Figure 3 A male with scar carcinoma of left inguinal region and thigh, receiving radical resection under intraoperative real-time ICG fluorescence imaging. (A) The gross appearance of the tumor; (B) The gross appearance of the wound after tumor resection; (C) Visible light image of the wound under intraoperative imaging; (D) Fluorescence image of the wound under intraoperative imaging. Red arrow indicates residual fluorescent signals; (E) The HE staining of the biopsied tissues in the superior margin of the wound after tumor resection; (F) The HE staining of the biopsied tissues in the outer margin of the wound after tumor resection; (G) The HE staining of the biopsied tissues in the medial lower margin of the wound after tumor resection. The scale bars indicate 200 μm.
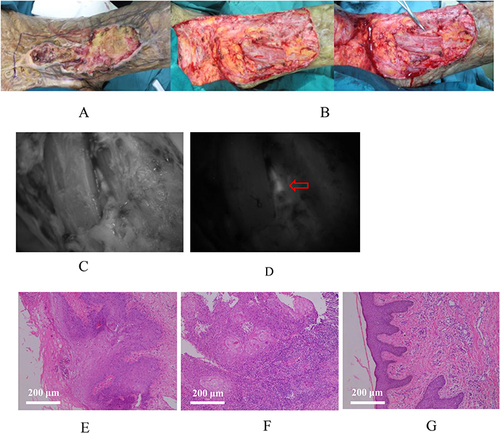
Figure 4 A female with squamous cell carcinoma of scalp, receiving preoperative and intraoperative ICG fluorescence imaging. (A) The gross appearance of the tumor; (B) Visible light image of the tumor under preoperative imaging; (C) Fluorescence image of the tumor under preoperative imaging; (D) Drawing the surgical margin based on the range of fluorescence; (E) The gross appearance of the wound after tumor resection; (F) Visible light image of the wound under intraoperative imaging; (G) Fluorescence image of the wound under intraoperative imaging; No residual fluorescence signal was found; (H) The HE staining of the resected tumor tissues. The scale bar indicates 200 μm.
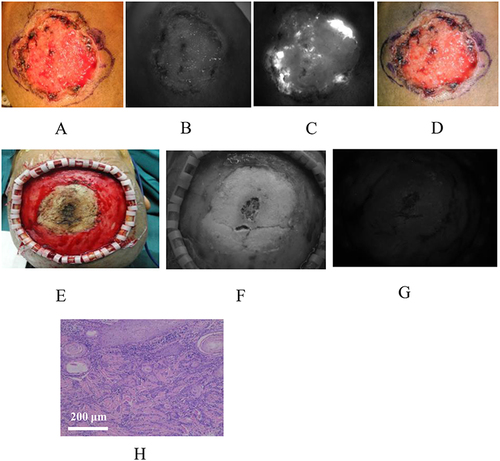
Table 3 Lymph Nodes Examination
Figure 5 Preoperative ICG fluorescence imaging of the sentinel lymph nodes on the right lower limb. (A) The surface location of the groin lymph nodes; A-1. Visible light image of the groin lymph nodes; A-2. Fluorescence image of the groin lymph nodes; (B) The surface location of the lymph nodes on the inner right thigh. B-1. Visible light image of the lymph nodes on the inner right thigh; B-2. Fluorescence image of the lymph nodes on the inner right thigh; (C) The HE staining of the resected tumor tissues. The scale bar indicates 100 μm.
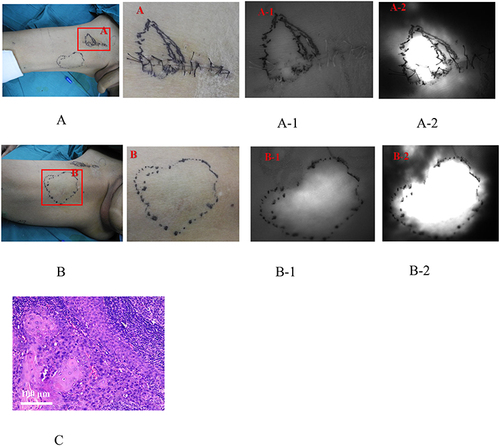
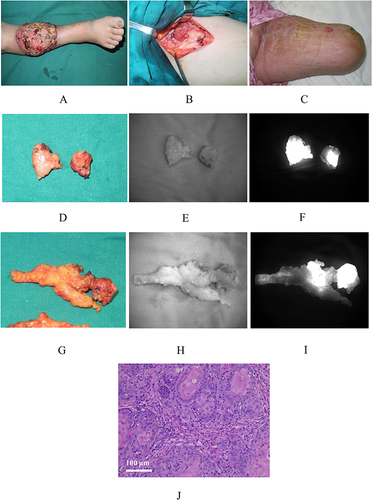
Figure 6 Intraoperative ICG fluorescence imaging of the well differentiated squamous cell carcinoma of the right leg. (A) The gross appearance of the tumor; (B) The gross appearance of the operation area in the right groin; (C) The postoperative residual limb; (D) The gross appearance of two lymph nodes in the right groin; (E) Visible light image of the two groin lymph nodes; (F) Fluorescence image of the two groin lymph nodes; (G) The gross appearance of another two lymph nodes in the right groin; (H) Visible light image of another two groin lymph nodes; (I) Fluorescence image of another two groin lymph nodes; (J) The HE staining of the resected tumor tissues. The scale bar indicates 100 μm.