Figures & data
Figure 1 Preventive role of M89PF on the skin barrier-associated protein Involucrin. Involucrin expression levels in skin explants samples exposed to O3, UV, O3+ UV and/or pretreated topically with M89PF for 24h and analyzed at DAY 1 (A) or DAY 4 (B). Magnification 40X. Scale bar 100 μm. Right panels shown the quantification of relative immunofluorescence staining for Involucrin after different treatments (DAY 1; DAY4). Data are expressed as the mean of the three different subjects ± standard deviation. *p≤0.05 Ctrl vs Pollutant; #p≤0.05 M89PF + Pollutant vs Corresponding pollutant. One-way ANOVA followed by Bonferroni post hoc test.
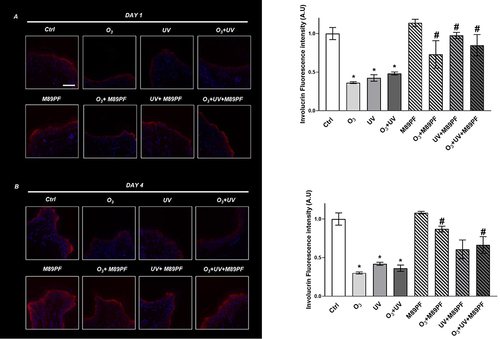
Figure 2 Preventive role of M89PF on the increased expression levels of the oxidative marker 4-HNE. 4-HNE expression levels in skin explants samples exposed to O3, UV, O3+ UV and/or pretreated topically with M89PF for 24h and analyzed at DAY 1 (A) or at DAY 4 (B). Magnification 40X. Scale bar 100 μm. Right panels show the quantification of relative immunofluorescence staining for 4-HNE after different treatments (upper panel, DAY1; below panel, DAY4). Data are expressed as the mean of the three different subjects ± standard deviation. *p≤0.05 Ctrl vs Pollutant; #p≤0.05 M89PF + Pollutant vs Corre-sponding Pollutant. One-way ANOVA followed by Bonferroni post hoc test.
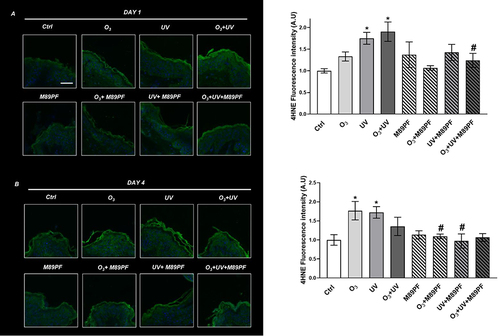
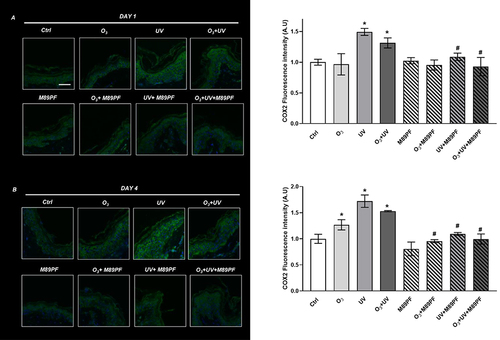
Figure 3 Preventive role of M89PF on the increased expression levels of cyclooxy-genase 2 (COX-2). COX-2 expression levels in skin explants samples exposed to O3, UV, O3+ UV and/or pretreated topically with M89PF for 24h and analyzed at DAY 1 (A) and DAY 4 (B). Magnification 40X. Scale bar 100 µm. Right panels show the quantification of relative immunofluorescence staining for COX-2 after different treatments (upper panel, DAY 1; below panel, DAY 4). Data are expressed as the mean of the three different subjects ± standard deviation. *p≤0.05 Ctrl vs Pollutant; #p≤0.05 M89PF + Pollutant vs Corre-sponding Pollutant. One-way ANOVA followed by Bonferroni post hoc test.