Figures & data
Figure 1 Validation of primary keratinocytes. Immunofluorescence assay detected K15, K19, and Keratin protein expression in primary cells. Scale bar, 100 μm.
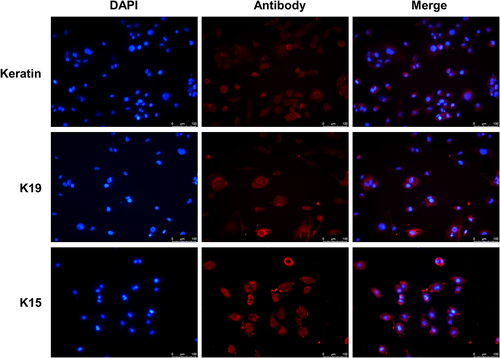
Figure 2 IL-27 concentration-dependently upregulated the viability in the primary cell and HaCaT. (A) CCK-8 assay detected viability in primary cells at 24 h and 48 h after IL-27 intervention. (B) CCK-8 assay detected viability in HaCaT at 24 h and 48 h after IL-27 intervention. Data represent mean ± standard deviation. n=3 for each group. Compared with the 0 ng/mL IL-27 group, **P<0.001.
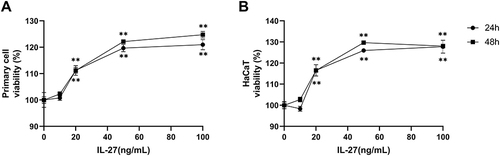
Figure 3 IL-27 concentration-dependently upregulated the protein levels of CyclinE and CyclinB1 in the primary cell and HaCaT. (A, C, and D) Western blot detected the protein levels of CyclinE and CyclinB1 in the primary cell at 24 h and 48 h after IL-27 intervention. (B, E, and F) Western blot detected the protein levels of CyclinE and CyclinB1 in HaCaT at 24 h and 48 h after IL-27 intervention. Data represent mean ± standard deviation. n=3 for each group. Compared with the 0 ng/mL IL-27 group, *P<0.05, ** P<0.001.
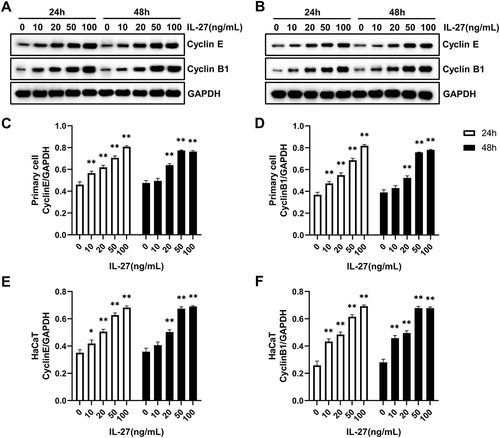
Figure 4 The volcano plots show DE lncRNAs, DE miRNAs, and DE mRNAs between the IL-27 group and control group. Red dots denote upregulated genes, blue dots denote downregulated genes and grey dots denote stable expressed genes in IL-27 group compared with control group.
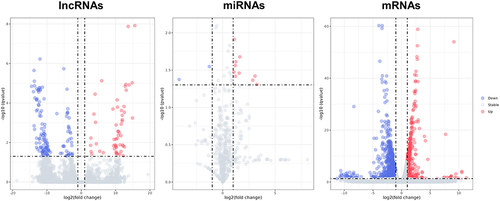
Figure 5 Results of KEGG enrichment analysis of DE RNAs. (A) Results of KEGG analysis of lncRNAs. (B) Results of KEGG analysis of miRNAs. (C) Results of KEGG analysis of mRNAs. The top 20 enriched KEGG pathways are listed according to the p-value. Gene_number represents the number of DE genes enriched in respective pathway. Rich factor represents the ratio of the number of DE genes under the pathway to the number of all genes annotated to this pathway.
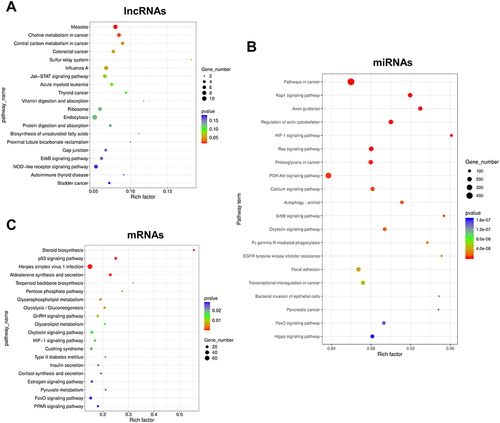
Figure 6 LncRNA-miRNA-mRNA network reveals the association among DE RNAs. Square, triangle, and cycle represent the DE lncRNAs, DE miRNAs, and DE mRNAs, respectively. The red color denotes upregulated gene and the blue color denotes downregulated gene. The black edges indicated the regulatory relationships between DE genes.
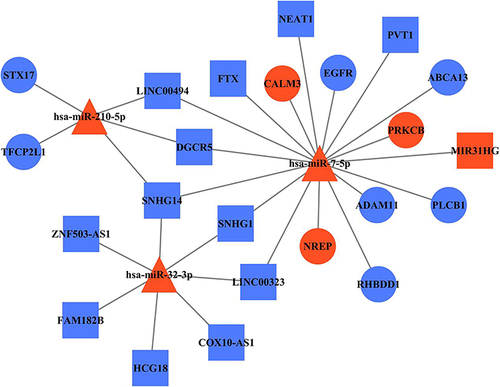
Figure 7 PPI network construction. PPI network of DE RNAs in the lncRNA-miRNA-mRNA network.
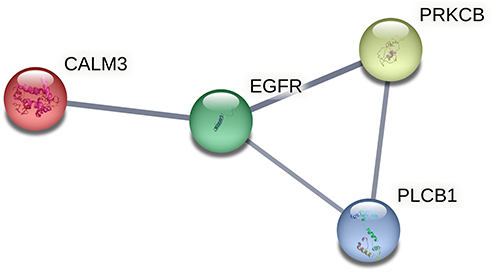
Figure 8 Verification of the accuracy of transcriptome sequencing. (A–D) qRT-PCR was used to detect the RNA expression levels of miR-7-5p (A), lncRNA MIR31HG (B), lncRNA NEAT1 (C), and EGFR (D). (E–H) Western blot was used to detect the protein expression levels of PRKCB (E and F), CALM3 (E and G), p-EGFR (E and H), and EGFR (E and H). Data represent mean ± standard deviation. n=3 for each group. Compared with the control group (0 ng/mL IL-27), **P<0.001.
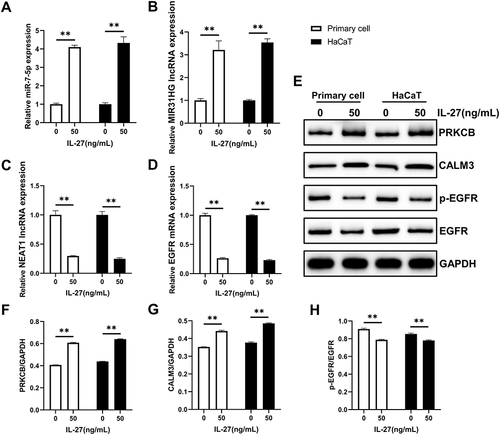
Figure 9 IL-27 strengthened Glycolysis in keratinocytes. (A–C) Glu (A), LA (B), and ATP (C) were detected by the biochemical test. (D–H) Glycolysis-related proteins including GLUT1 (D and E), HK2 (D and F), LDHA (D and G), and PGK1 (D and H) were detected by Western blot. Data represent mean ± standard deviation. n=3 for each group. Compared with the control group (0 ng/mL IL-27), **P<0.001.
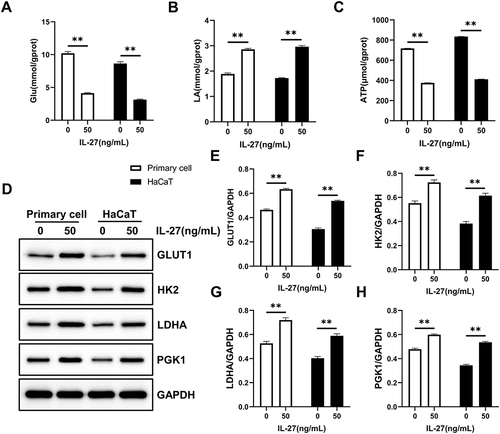
Figure 10 IL-27 enhanced mitochondrial function and promoted mitochondrial fusion in keratinocytes. (A and B) JC-1 assay was used to detect mitochondrial function. (C–E) Western blot was used to detect the protein expression levels of p-DRP1 (C and D), DRP1 (C and D), and MFN2 (C and E). Data represent mean ± standard deviation. n=3 for each group. Compared with the control group (0 ng/mL IL-27), **P<0.001.
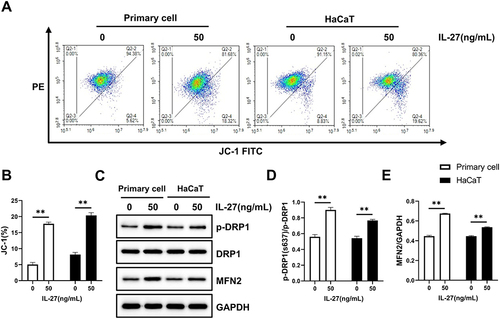
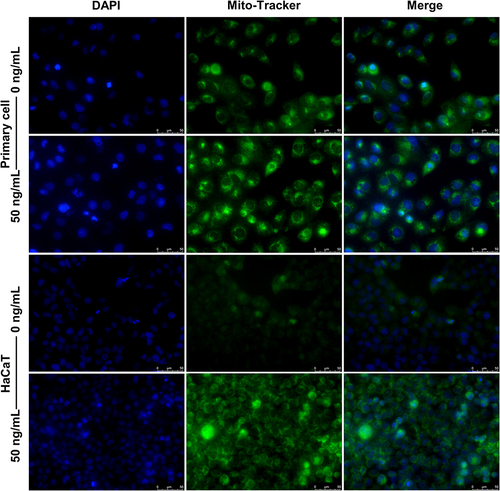
Figure 11 IL-27 increased the number of mitochondria. The number of mitochondria was detected by Mito-Tracker Green staining. Scale bar, 50 μm.