
Figures & data
Figure 1 The time course of treatment and states of illness.
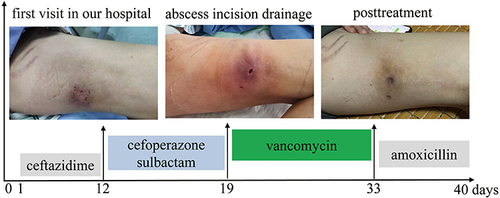
Figure 2 (A and D): The cicatrix, fibrocollagenous nodules and multiple calcifications in abdomen and thighs. (B and E): The characteristic features of dermatomyositis: Heliotrope sign, V sign and Gottron sign. (C) (HE×40) and (F) (HE×100): Biopsy of the subcutaneous firm nodules in the trunk revealed localized collagen hyperplasia in the dermis, accompanied by significant mucin deposition, as well as adipose septal fibrosis and hyalinization in the subcutaneous adipose tissue, featuring lipomatous cysts and membranous changes, with a minor infiltration of lymphocytes in the dermis and subcutaneous adipose tissue. (G and H): T1-weighted MR images revealed high signal intensity in sartorius muscle (white arrows) and intermuscular space. (I): The chest CT scan identified subcutaneous calcified nodules (white arrow).
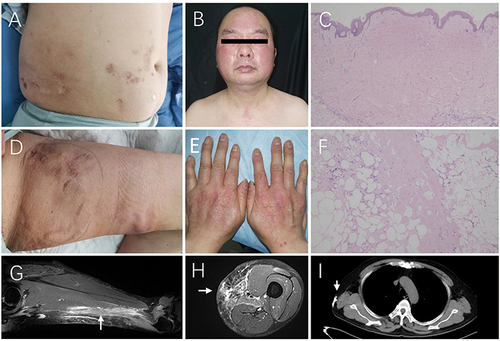
Figure 3 The literature screening flowchart.
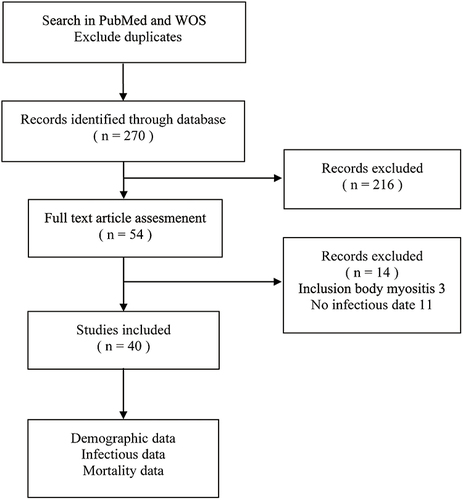
Table 1 The Clinical Data and Mortality Rates in Patients with IIM
Table 2 The Clinical Data and Prevalence of Infections in Patients with Different IIM Subtypes
Table 3 The Clinical Data and Prevalence of Infections in Patients with Different Infection Types