Figures & data
Figure 1 The expression levels of LXA4 and ALOX15 were reduced in IMQ-induced psoriasis-like mouse skin lesions. (A) LXA4 protein level was evaluated by ELISA in skin tissue. (B) ALOX15 protein level was detected by Western blot in each candidate mouse skin tissue. 1#, 2#, 3# was mouse number, and β-actin was used as normalization control. (C) Relative band intensity of picture (B) was detected by grey scanning of Image J software. All data were conducted three independent experiments, and the representative results are shown. Mean ± SD, *p<0.05, ***p<0.001, compared with the mice in the IMQ group.
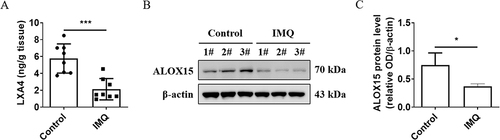
Figure 2 LXA4 alleviates the pathological features of psoriasiform dermatitis in mice. (A) After 7 days of continuous treatment, a representative picture of the dorsal skin of each group. (B) Each group of mice was assessed daily for epidermal erythema, scaling and thickening of the dorsal skin, the disease severity score was the sum of the scores of the three indicators. (C) Histology of lesions tissue (H&E stain, scale bar: 100 mm) of dorsal skin in three groups of mice. All data were conducted three independent experiments, and the representative results are shown. NS p>0.05, **p<0.01 and *p<0.05, compared with the mice in the IMQ group. Each bar represents the mean ± SD (n=8).
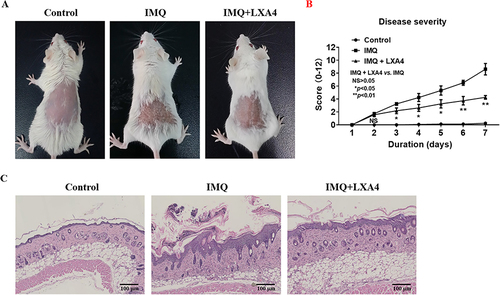
Figure 3 LXA4 suppressed the expression of TNF-α, IL-1β, IL-17A and CCL20 and the percentage of IL-17A-expressing cells in IMQ-induced psoriasis-like mice. The serum concentration of TNF-α (A), IL-1β (B), IL-17A (C), CCL20 (D) was detected by ELISA. The mRNA expression of TNF-α (E), IL-1β (F), IL-17A (G), CCL20 (H) in the skin lesions were analyzed by Real-time quantitative PCR. The percentages of IL-17A-expressing cells within the CD3+ γδT cells in skin lesions (I) and cervical lymph nodes (LNs) (J), and within the CD3+ CD4+ cells in spleens (K) were detected by flow cytometry. Representative flow plots and absolute number are shown. Cells were gated on γδTCR and CD4 T cells, respectively. Data are representative of at least three independent experiments with similar results. Mean ± SD, *p<0.05, **p<0.01, ***p<0.001 and ****p<0.001, compared with the mice in the IMQ group.
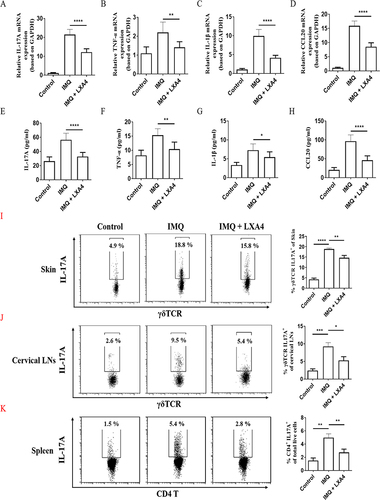
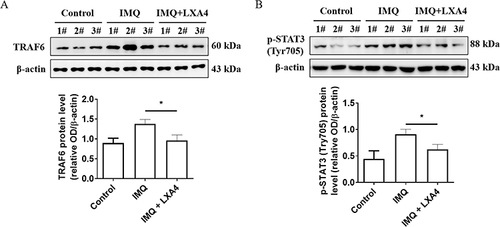
Figure 4 Effects of LXA4 on TRAF6 and p-STAT3 expression in psoriasis-like lesions. TRAF6 (A) and p-STAT3 (B) protein level was detected by Western blot in each candidate mouse skin tissue (upper panel), relative band intensity of TRAF6 and p-STAT3 were detected by grey scanning of Image J software (lower panel). 1#, 2#, 3# was mouse number, and β-actin was used as normalization control. All data were conducted three independent experiments, and the representative results are shown. The results are shown as the mean ± SD. *p<0.05. Relative band intensity of picture (B) detected grey scanning by Image J software.