
Figures & data

Table 1 Population Distribution
Table 2 Product Sources
Figure 1 Demonstration of the results of the preliminary diagnosis through pie charts.
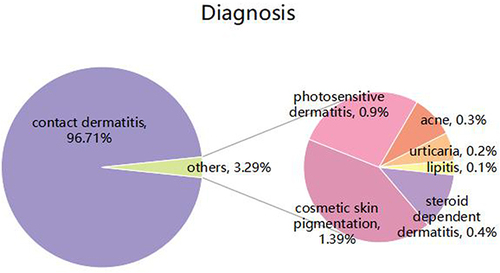
Table 3 Onset Time
Figure 2 Lesion site, conscious symptoms, lesion pattern. (A) Demonstration of body sites of disease by radar diagram (B) Demonstration of facial onset by radar diagram (C) Demonstrating symptoms of consciousness through radar diagram (D) Demonstration of lesion type by radar diagram.
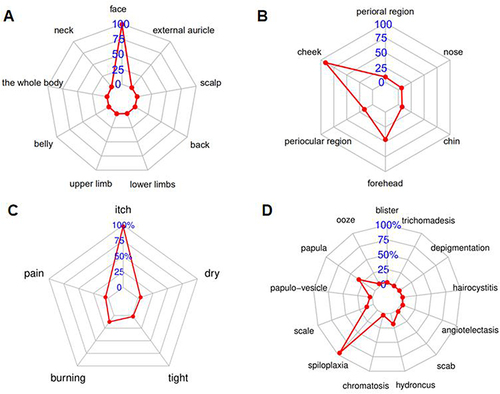
Table 4 Independent Factors
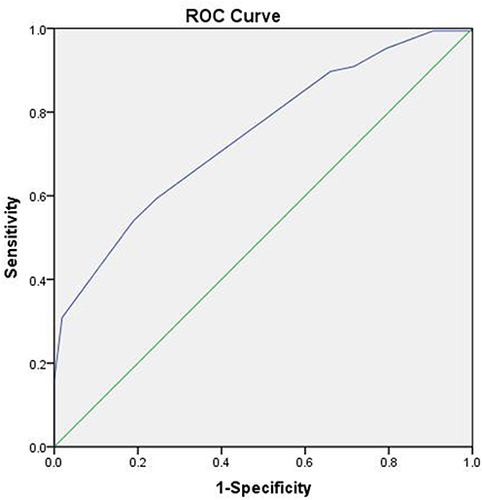
Figure 3 Use the ROC curve to evaluate the performance of the model.
Data Sharing Statement
The data is not publicly available due to the contain information that could compromise confidentiality of the patients.