Figures & data
Figure 1 Color comparison of the skin of the two groups before and after the molding. (A) Representative pictures of skin color changes on the back of Guinea pigs in groups U and P before and after modeling. (B) Gray scale statistical analysis results of back skin of Guinea pigs in group U before and after modeling. (C) gray scale statistical analysis results of back skin of Guinea pigs in group P before and after modeling. (D) Gray scale statistical analysis results of back skin of Guinea pigs in groups U and P before modeling. (E) statistical analysis results of gray scale of back skin of Guinea pigs in groups U and P after modeling. Note: ** represents P < 0.01, ns represents P > 0.05. U group: an ultraviolet radiation, P group: a combination of progesterone injection and ultraviolet radiation.
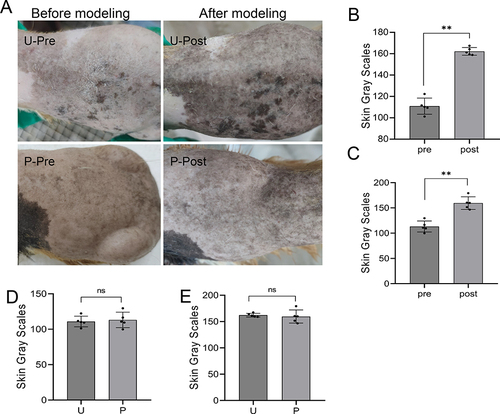
Figure 2 H&E and Masson staining (× 100). (A) H&E staining was used to detect the pathological changes of Guinea pig skin. (B) Masson staining was used to detect melanin deposition in Guinea pig skin tissue. B group: blank group, U group: an ultraviolet radiation, P group: a combination of progesterone injection and ultraviolet radiation.
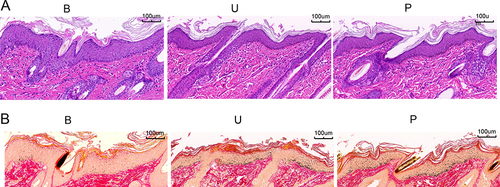
Figure 3 Principal component analysis (PCA) and the number of proteins identified in the GO, KEGG, and COG databases. (A) Principal component analysis of skin samples from three groups of Guinea pigs. (B) Venn diagram of proteins screened by GO, KEGG and COG databases.
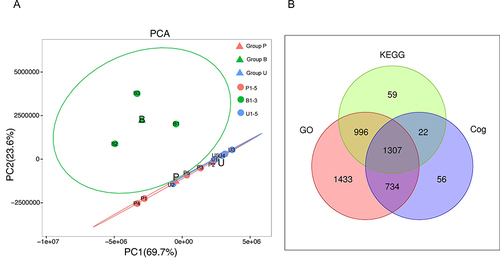
Figure 4 GO and KEGG classification annotation diagram. (A) GO enrichment analysis results, including cell components, molecular functions and biological processes. (B) KEGG enrichment analysis results.
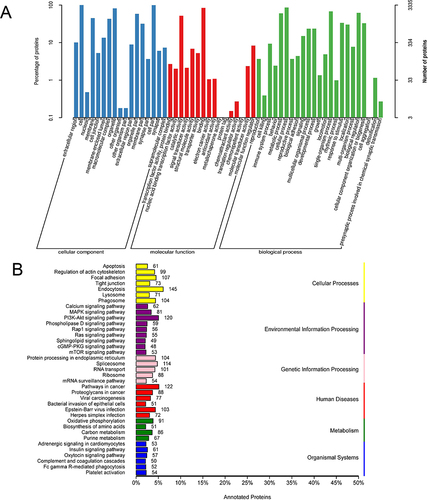
Figure 5 The volcano plot and Wayne plot of the differential expressed proteins (DEPs). (A) Volcano map of DEPs between the group U and group B. (B) Volcano map of DEPs between the group P and group B. (C) Volcano map of DEPs between the P and U groups. (D) Wayne plot of DEPs in each comparative group. B group: blank group, U group: an ultraviolet radiation, P group: a combination of progesterone injection and ultraviolet radiation.
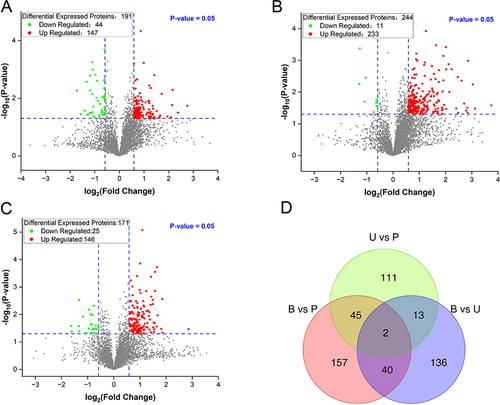
Figure 6 Enrich circos plot of the differentially expressed protein (DEPs) between the group U and group B. (A) Molecular functional (MF) enrichment analysis. (B) Cell component (CC) enrichment analysis. (C) Biological process (BP) enrichment analysis. (D) Kyoto encyclopedia of genes and genomes (KEGG) analysis of DEPs. B group: blank group, U group: an ultraviolet radiation.
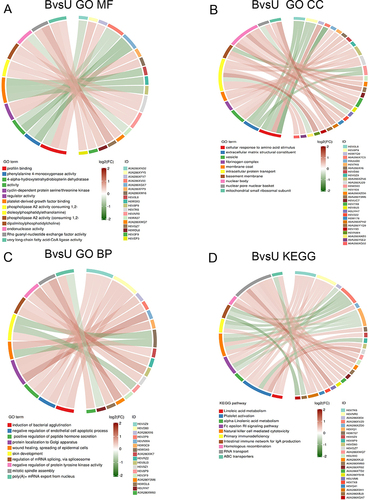
Figure 7 Enrich circos plot of the differentially expressed protein (DEPs) between the group P and group B. (A) Molecular functional (MF) enrichment analysis. (B) Cell component (CC) enrichment analysis. (C) Biological process (BP) enrichment analysis. (D) Kyoto encyclopedia of genes and genomes (KEGG) analysis of DEPs. B group: blank group, P group: a combination of progesterone injection and ultraviolet radiation.
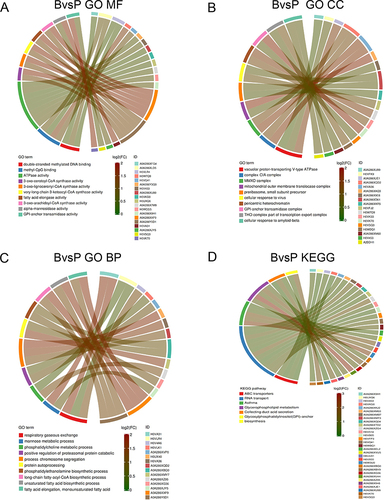
Figure 8 Enrich circos plot of the differentially expressed protein (DEPs) between the group P and group U. (A) Molecular functional (MF) enrichment analysis. (B) Cell component (CC) enrichment analysis. (C) Biological process (BP) enrichment analysis. (D) Kyoto encyclopedia of genes and genomes (KEGG) analysis of DEPs. U group: an ultraviolet radiation, P group: a combination of progesterone injection and ultraviolet radiation.
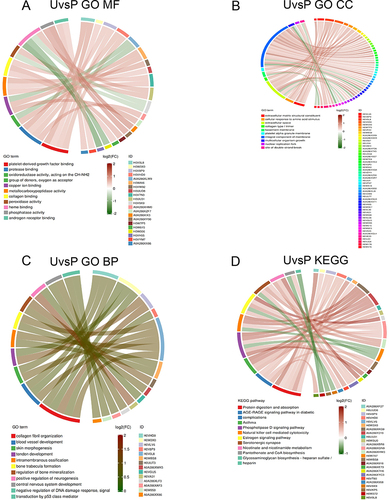
Figure 9 Functional network analysis of the differentially expressed protein (DEPs) between the group P and group U. (A) Network enrichment analysis of molecular functions (MF). (B) Network enrichment analysis of cell components (CC). (C) Network enrichment analysis of biological processes (BP). (D) Network enrichment analysis of the KEGG analysis. U group: an ultraviolet radiation, P group: a combination of progesterone injection and ultraviolet radiation.
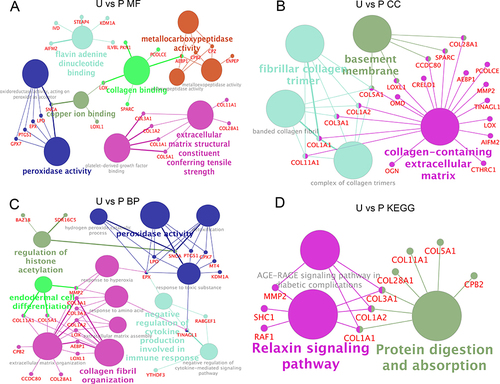
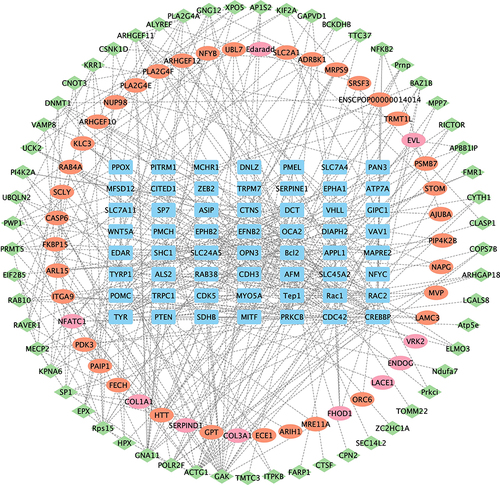
Figure 10 Differential protein and melanin-related gene PPI. The rectangles (in blue) represent key melanin genes, the ellipses (in red) represent the differentially upregulated genes in the B vs U group, the ellipses (in pink) represent the differentially downregulated genes in the B vs U group, and the diamonds (in green) represent the differentially upregulated genes in the B vs P group. The genes in each group are arranged in order of Betweenness Centrality values. B group: blank group, U group: an ultraviolet radiation, P group: a combination of progesterone injection and ultraviolet radiation.