Figures & data
Table 1 Primer Sequences
Table 2 Clinical, Sociodemographic, Anthropometric and Biochemical Characteristics of Psoriatic Vulgaris Patients and Controls
Figure 1 Serum interleukin (IL)-9 level of psoriasis vulgaris patients with metabolic syndrome (PVMS) (n = 75) compared with psoriasis vulgaris patients without metabolic syndrome (PVNMS) (n = 57) and healthy controls (n = 20). Data are expressed as the mean ± SD (A). Serum IL-17A level of PVMS (n = 75) compared with PVNMS (n = 57). Data are expressed as median with interquartile range (B). *P < 0.05, and ***P < 0.001.
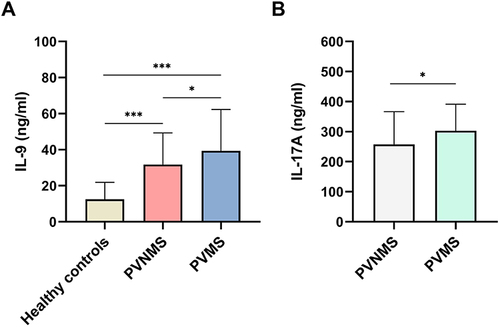
Figure 2 Expression of interleukin (IL)-9 in psoriasis vulgaris and normal human skin. IL-9 staining rarely occurred in normal dermis ((A), n = 7), whereas scattered and strong expression was observed in inflammatory cells (red arrow) and vascular endothelial cells (black arrow) in the skin of psoriasis vulgaris patients without metabolic syndrome (PVNMS) ((B), n = 30) or psoriasis vulgaris patients with metabolic syndrome (PVMS) ((C), n = 30), respectively (Scale bar, 50 μm). The expression levels were quantitatively analyzed by Image-pro Plus (D). IOD, integrated optical density. Data are expressed as the mean ± SD. *P < 0.05, **P < 0.01.
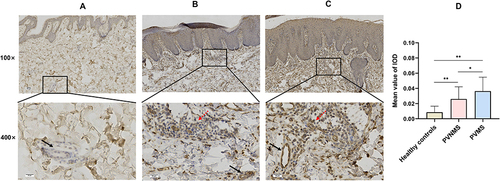
Figure 3 Expression of interleukin-9 receptor (IL-9R) in psoriasis vulgaris and normal human skin. Representative images of immunohistochemistry staining are shown for absent, weak, and strong expression of IL-9R in keratinocytes and inflammatory cells of normal skin ((A), n = 7), the skin of psoriasis vulgaris patients without metabolic syndrome (PVNMS) ((B), n = 30) and the skin of psoriasis vulgaris patients with MetS (PVMS), respectively ((C), n = 30). The red arrow indicates the positive expression of IL-9R in the cytomembrane of keratinocytes (Scale bar, 50 μm). The expression levels were quantitatively analyzed by Image-pro Plus (D). IOD, integrated optical density. Data are expressed as the mean ± SD. **P < 0.01, ***P < 0.001.
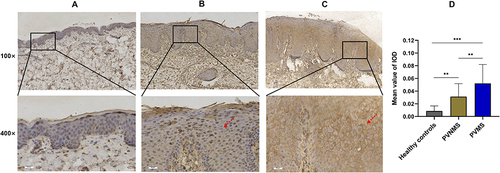
Table 3 Spearman Correlation Coefficients Between Serum IL-9 Level and Serum IL-17A Level, Clinical Features and Metabolic Syndrome Components in Psoriasis Vulgaris Patients
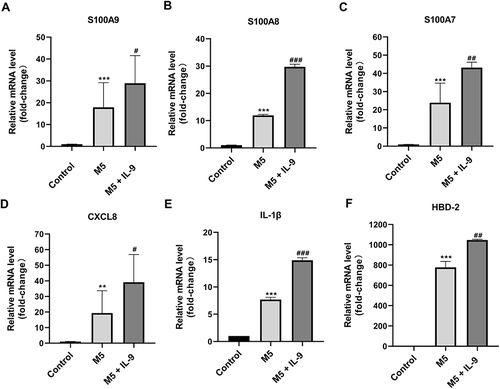
Figure 4 Interleukin (IL)-9 promoted antimicrobial peptides and chemokines gene expression in M5-treated normal human epidermal keratinocytes (NHEKs). NHEKs were treated with M5 (10 ng/mL) for 24 hours and then cultured in the presence or absence of IL-9 (100 ng/mL). The mRNA levels of S100A9 (A), S100A8 (B), S100A7 (C), CXCL8 (D), IL-1β (E) and HBD-2 (F) were measured by qRT-PCR. Data are expressed as the mean ± SD. **P < 0.01, and ***P < 0.001 vs control group; #P < 0.05, ##P < 0.01 and ###P < 0.001 vs M5 group. S100A7, S100 calcium-binding protein A7; S100A8, S100 calcium-binding protein A8; S100A9, S100 calcium-binding protein A9; CXCL8, C-X-C motif chemokine ligand 8; IL-1β, interleukin 1 beta; HBD-2, human beta-defensin 2.