Figures & data
Figure 1 (A) The morphology changes of the lesion skin in psoriasis mice. I, Control; II, Model; III, Cur 50 mg/kg; IV, Cur 100 mg/kg. The selected pictures were typical skin lesions in each group, N=4 per group.
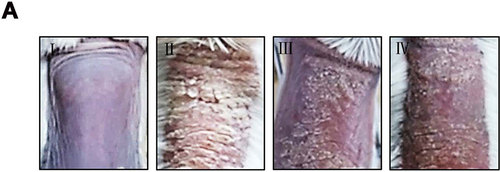
Table 1 All Sequences of the Primers Used in This Experiment
Figure 2 PASI score of the lesion skin in psoriasis mice. (A–D) PASI score comparison between different groups, IMQ vs Cur, *P< 0.05, **P<0.01.
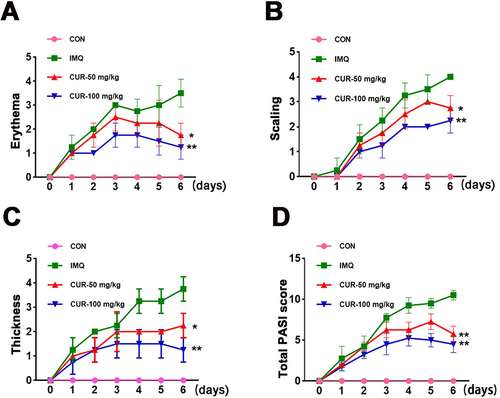
Figure 3 The histopathological changes of the lesion skin in psoriasis mice, and effect of CUR on the protein expression of TNF-α and IL-6 in lesion skin of the psoriasis mice. (A) Results of HE staining between groups. (B) IHC staining of TNF-α. (C) IHC staining of IL-6. I, Control; II, Model; III, CUR 50 mg/kg; IV, CUR 100 mg/kg. Scale bar, 50μm. The selected pictures were typical in each group, N=4 per group.
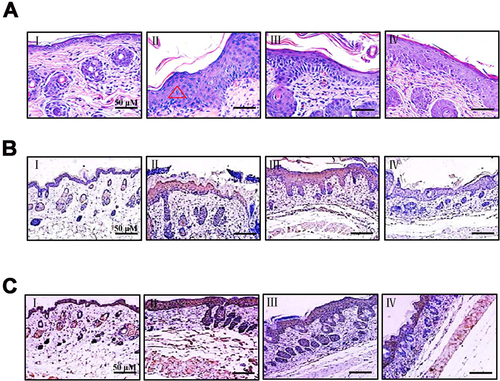
Figure 4 The epidermal protein and mRNA levels of TNF-α and IL-6 in psoriasis mice. (A and B) The harvested skin tissues were subjected to the ELISA kits for detecting protein levels of IL-6 and TNF-α. (C and D) The epidermal mRNA levels of mice were measured by qPCR. N=4 per group. *P< 0.05, **P<0.01, ***P<0.001.
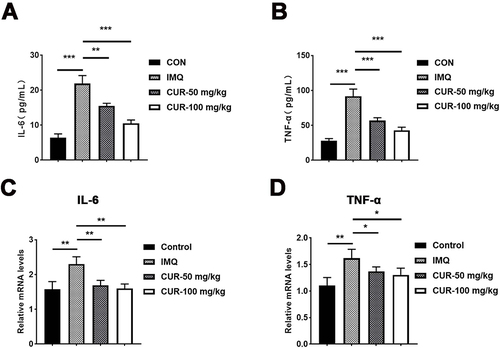
Figure 5 Effect of CUR on the signaling pathway of STAT 3 in lesion skin of the psoriasis mice. (A) The protein levels of p-STAT3, T-STAT3, Cyclin D1, Bcl-2 and Pim1 were determined by Western blotting. (B–F) Gray statistics for each protein. p, phosphorylation; T, total. *P< 0.05, **P<0.01, ***P<0.01.
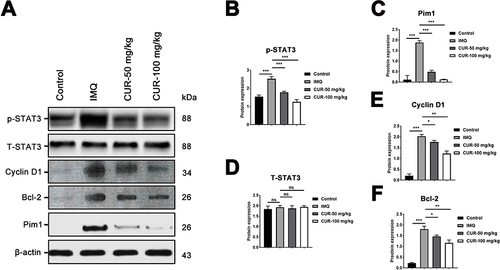
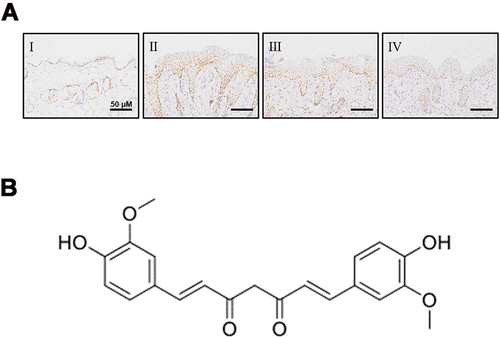
Figure 6 (A) The effect of CUR on the protein expression of p-STAT3 in lesion skin of the psoriasis mice. I, Control; II, Model; III, CUR 50 mg/kg; IV, CUR 100 mg/kg. Scale bar, 50μm. The selected images were typical skin lesions in each group, N=4 per group. (B) The structure of curcumin.