
Figures & data
Table 1 Demographic Data and Characteristics of Pediatric AA Patients in Different Groups
Figure 1 Proportion of efficacy outcomes.
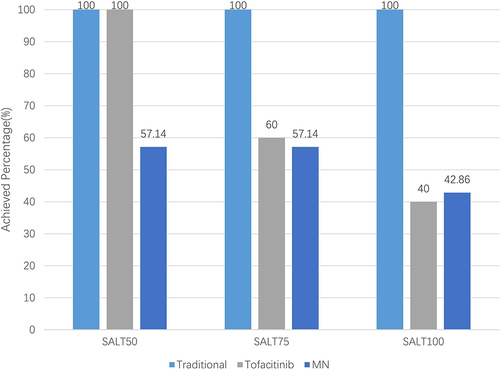
Table 2 Endpoint SALT Score and Recurrence in Each Group
Figure 2 Photographs of a representative patient in the traditional group: panel A-D showed different regions of scalp before and after treatment ((A) top, (B) posterior, (C) left side, (D) right side).
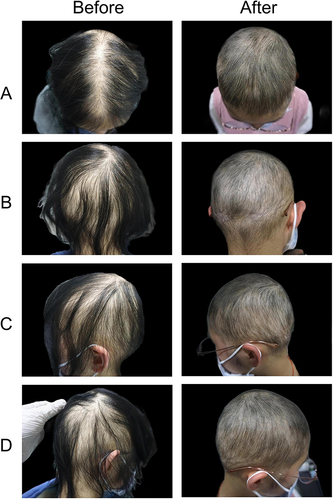
Figure 3 Photographs of a representative patient in the tofacitinib group: panel A-D showed different regions of scalp before and after treatment ((A) top, (B) posterior, (C) left side, (D) right side).
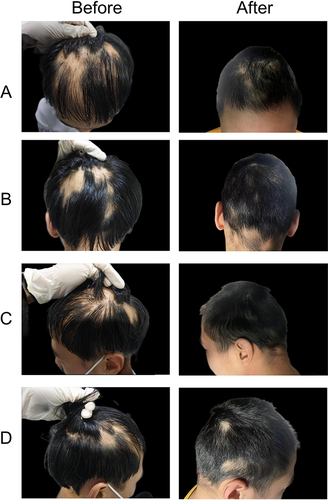
Figure 4 Photographs of a representative patient in the MN group: panel A-C showed different regions of scalp before and after treatment ((A) top, (B) left side, (C) right side).
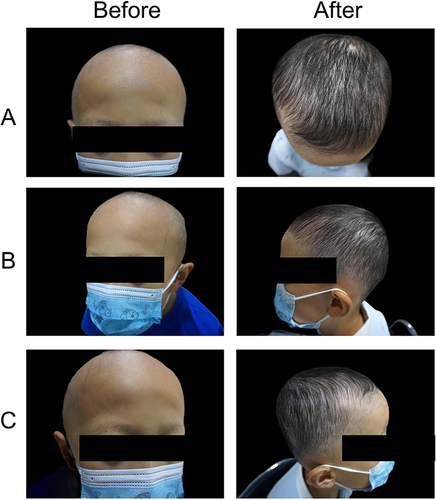
Table 3 Cost Parameters