Figures & data
Figure 1 A flow chart of study process.
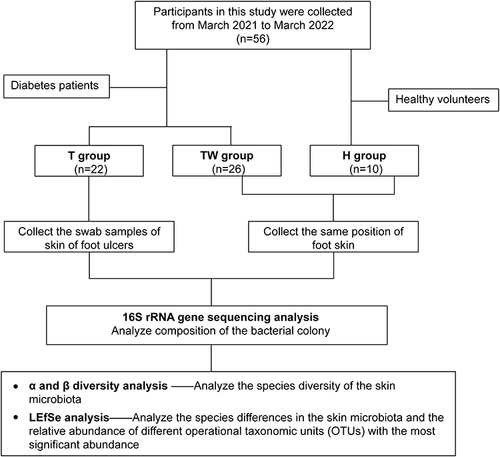
Figure 2 Composition of bacterial colonies. (A) Venn diagram of sequencing results of the skin bacterial colony in three groups of subjects by OTU analysis; (B–D) assessment of bacterial colony structure in three groups of samples at phylum, family, and genus levels.
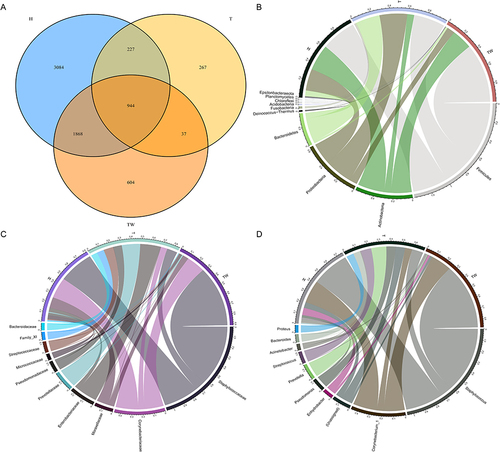
Figure 3 Bacterial colony composition. Bacterial colony structure of the top 15 most abundant different OTUs in T, TW, and H groups.
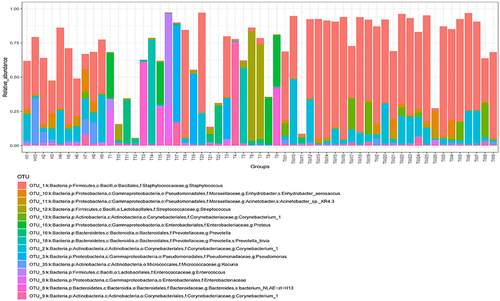
Figure 4 Variation of α-diversity index among the three groups. (A) α diversity analysis of chao1. (B) α diversity analysis of Shannon. (C) α diversity analysis of Simpson. (D) α diversity analysis of richness.
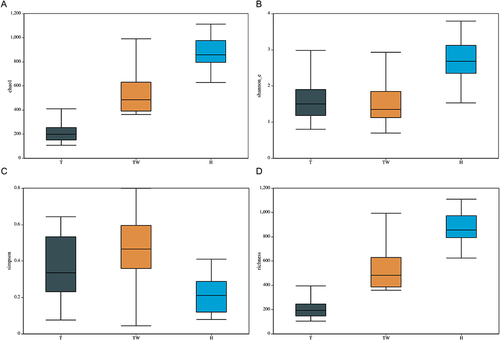
Figure 5 β diversity of microbiota in the three groups. (A) PCoA analysis based on Bray–Curtis. (B) PCoA analysis based on Euclidean.
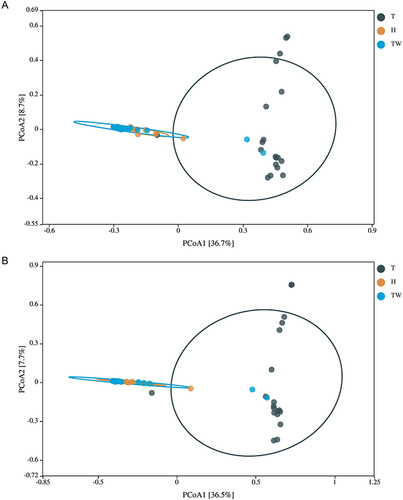
Figure 6 LEfSe analysis. (A) composition of species that differ in bacterial colonies in T, TW, and H groups revealed by LEfSe analysis. (B) linear discriminant analysis of microbiota that differ significantly between groups.
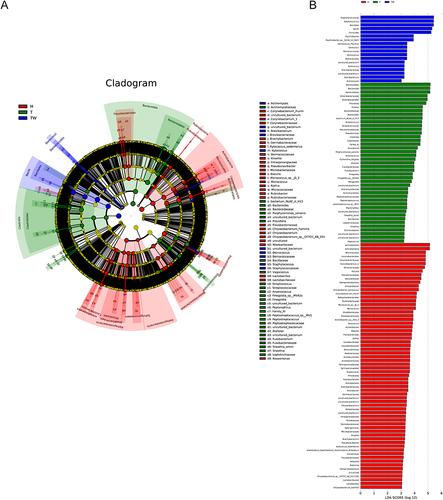
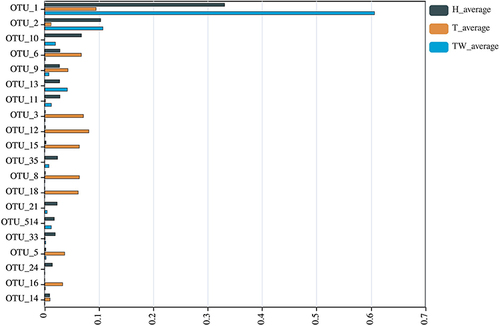
Figure 7 Relative abundance percentages of the different operational taxonomic units with the most significant abundance in the T, TW, and H groups.