Figures & data
Table 1 Baseline Characteristics of Patients with PsO and Clinical Photography
Figure 1 Percentage of patients achieving improvements in skin and patient-reported outcomes at Week 12. All graphs show upper 95% confidence limits.
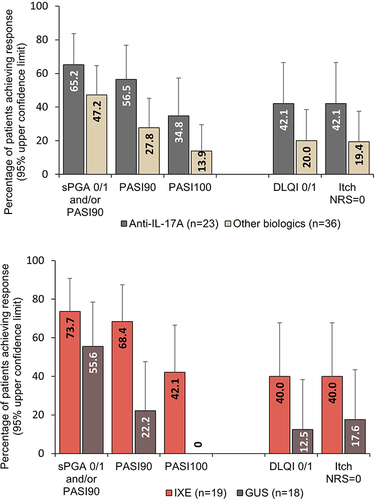
Figure 2 Proportion of patients showing improvements in PSSD signs and symptoms summary scores at Week 12. PSSD Signs and Symptoms summary score graphs show mean scores and upper and lower 95% confidence limits. PSSD Signs and Symptoms summary scores can range from 0 to 100. Lower scores indicate less severe disease.
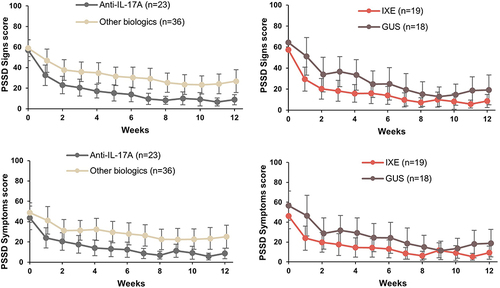
Figure 3 Visual treatment effects of IXE at Week 12. (A) Male aged 47 years from Italy; psoriasis for 6 years, bio-naïve, previous systemic conventional therapy, no PsA, diabetes mellitus, overweight, atherosclerosis, dyslipidemia, hypertension and liver disease, initiated IXE as per EMA label at baseline; (B) Female aged 45 from Taiwan; psoriasis for 19 years, bio-experienced, previous systemic conventional therapy, PsA and obesity, switched to IXE as per EMA label at baseline.
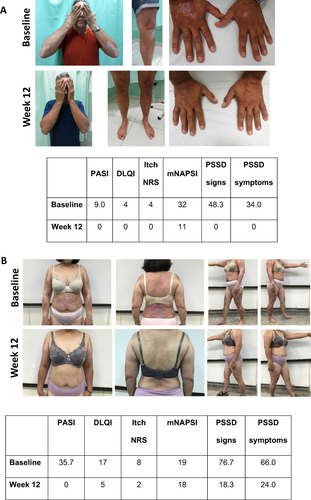
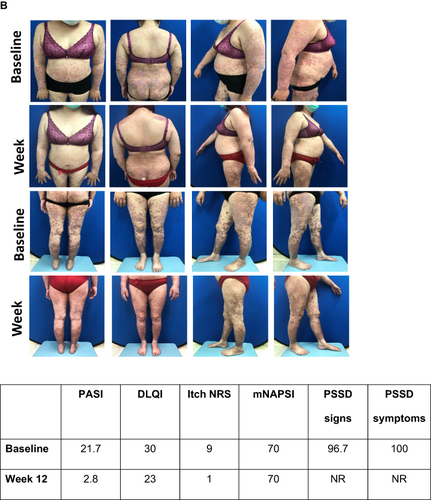
Figure 4 Continued.
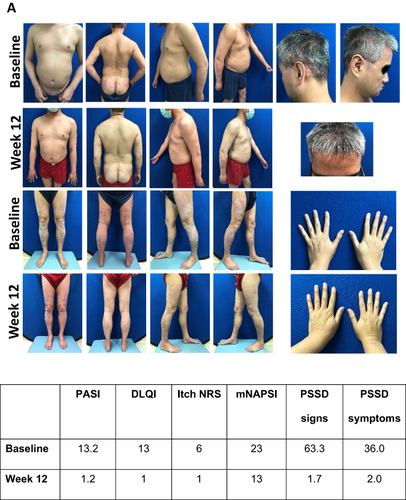
Figure 4 Visual treatment effects of GUS at Week 12. (A) Male aged 38 from Taiwan; psoriasis for 11.4 years, bio-naïve, previous systemic conventional therapy, disease duration 12 years, no PsA, overweight, dyslipidemia and hypertension. Initiated GUS as per label at baseline. (B) Female aged 45 from Taiwan; psoriasis for 13 years, bio-experienced, previous systemic conventional therapy, disease duration 13 years, PsA. Switched to GUS as per label at baseline.