
Figures & data
Table 1 Table of Clinical Baseline Information
Table 2 Comparison of Clinical Efficacy
Figure 1 Comparison of ECCA score and scar base depth (there were 60 cases in each of research and control groups). (A) ECCA score before and after treatment. (B) Scar base depth before and after treatment. #: vs before treatment, P<0.05. &: vs control group, P<0.05.
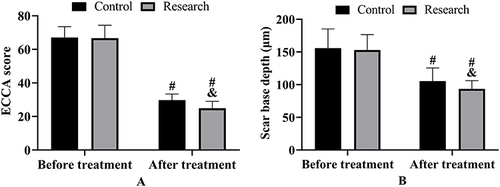
Figure 2 Comparison of skin condition. (A) The pore value of the skin before and after treatment (there were 60 cases in each of research and control groups). (B) The texture value of the skin before and after treatment. #: vs before treatment, P<0.05. &: vs control group, P<0.05.
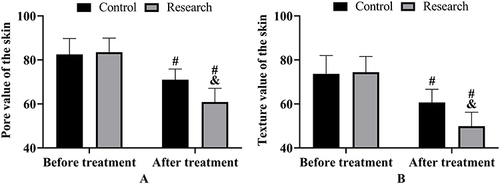
Figure 3 Comparison of recovery time (there were 60 cases in each of research and control groups). (A) Comparison of duration of redness. (B) Comparison of scabbing. (C) Comparison of erythema. ##P<0.01.
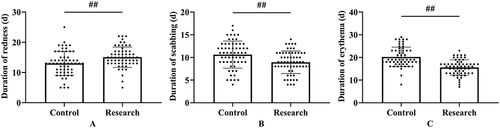
Figure 4 Comparison of skin barrier function (there were 60 cases in each of research and control groups). (A) Skin water content before and after treatment. (B) Epidermal oil content before and after treatment. (C) TEWL before and after treatment. #: vs before treatment, P<0.05. &: vs control group, P<0.05.
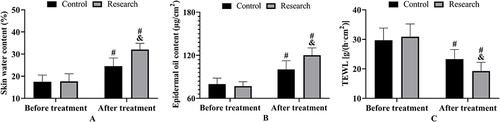
Table 3 Incidence of Adverse Reactions
Data Sharing Statement
The data that support the findings of this study are available from the corresponding author upon reasonable request.