Figures & data
Table 1 The Features and Details of AA Research Participants
Table 2 The Genomic Locations on SNP in AA Disease (p<1E-07)
Figure 1 The relationship of genome-wide variations with AA as determined by Manhattan plot analysis. SNP that passed quality control are plotted on the X-axis according to their chromosomal locations versus the Y-axis in Manhattan plot analysis (-log10 p-value). The higher solid line represents the genome-wide significance criterion (P<5E-8).
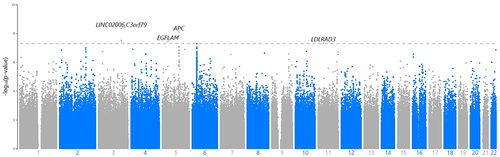
Figure 2 The relationship of genome-wide variations with AA as determined by quantile-quantile (QQ) plot analysis. The lambda (based on median chisq) was 0.875.
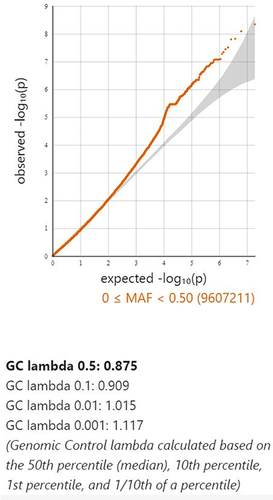
Figure 3 Regional association plot of NOTCH4 (A) and HLA-DQA1 gene (B) in AA. Regional plots for the loci showing significant differences in effect-size estimates. The plot typically shows the position of each SNP along the x-axis and the negative log10 P-value. Color of the point was used to show the linkage disequilibrium (LD) between SNPs.
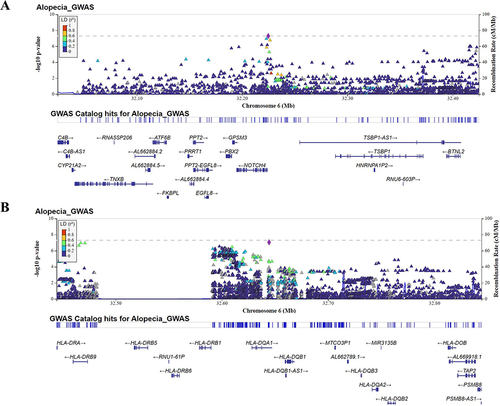
Table 3 The Top 25 Canonical Network Analysis of GWAS Results in AA Disease
Figure 4 Network studies of 882 SNP gene locations that are associated with AA. Cross analysis of the number of genes and pathways (SNPs gene loci, P<1E-05).
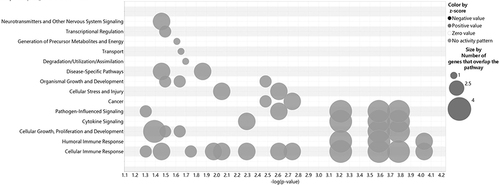
Figure 5 Network analyses of the antigen presentation pathway target gene (A) and the gene that Notch signaling targets (B). IPA software analyzed network analysis (SNPs gene loci, P<1E-05).
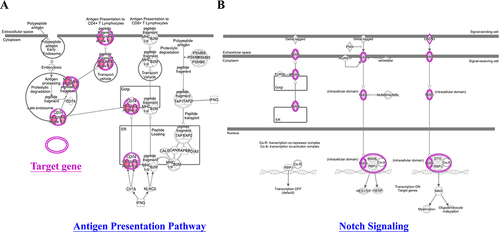
Figure 6 The genetic markers associated with skin and hair diseases (A). Nine genetic markers associated with the IFN-γ-JAK-STAT signal transmission pathway (B). IPA software analyzed network analysis (SNPs gene loci, P<1E-05).
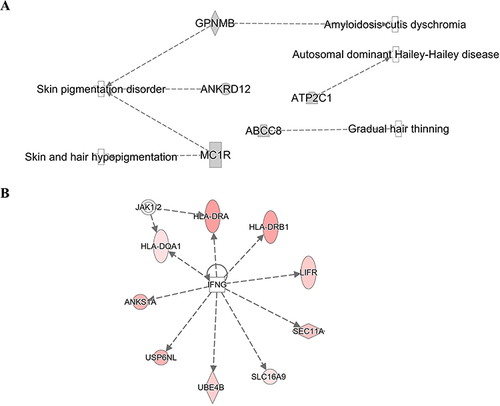
Table 4 HLA Genotypes and Allele Frequency Significantly Associated with AA in a Taiwanese Population (Adjust p-value<0.05)
Table 5 AA Disease-Related Target Gene and SNP Location Analysis in Taiwan and International Studies
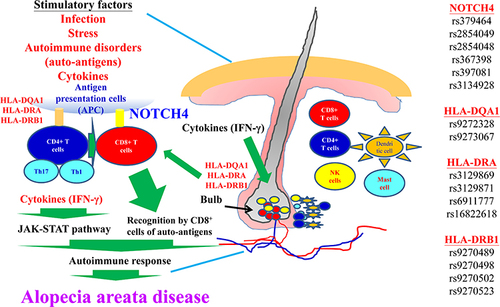
Figure 7 The molecular mechanisms involved in AA disease are depicted. Details are provided in the text.