
Figures & data
Figure 1 Diagram of ReA structure.
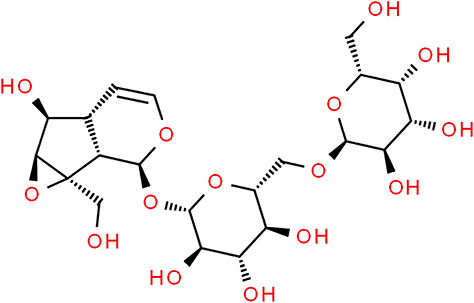
Table 1 RT-qPCR Primers
Figure 2 ReA inhibits the proliferation of HaCaT cells. MTT assay for viability of HaCaT cells in ReA solution 0 μg/mL group, 5 μg/mL group, 10 μg/mL group, 25 μg/mL group and 50 μg/mL group. **P < 0.01, vs 0 μg/mL group.
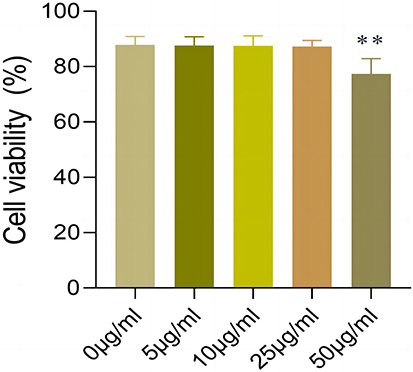
Figure 3 IL-17A induces overproliferation of HaCaT cells. (A) MTT assay of the HaCaT cell viability in IL-17A solution 0 ng/mL group, 10 ng/mL group, 50 ng/mL group, 100 ng/mL group. (B) RT-qPCR results of KRT6 expression in HaCaT cells in IL-17A solution 0 ng/mL group, 10 ng/mL group, 50 ng/mL group, 100 ng/mL group. (C) RT-qPCR results of KRT17 expression in HaCaT cells in IL-17A solution 0 ng/mL group, 10 ng/mL group, 50 ng/mL group and 100 ng/mL group. *P < 0.05, vs 0 ng/mL group; **P < 0.01, vs 0 ng/mL group.
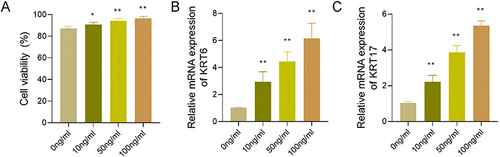
Figure 4 ReA inhibits IL-17A-induced overproliferation of HaCaT cells. (A) MTT detection of the viability of HaCaT cells in Control group, ReA group, IL-17A group, IL-17A+ReA group. (B) RT-qPCR detection of the expression level of KRT6 in HaCaT cells in Control group, ReA group, IL-17A group, IL-17A+ReA group. (C) RT-qPCR detection of expression level of KRT17 in HaCaT cells in Control group, ReA group, IL-17A group, IL-17A+ReA group. (D) Flow cytometry detection of cell cycles in HaCaT cells in Control group, ReA group, IL-17A group, IL-17A+ReA group. **P < 0.01, vs Control group; ##P < 0.01, vs IL-17A group.
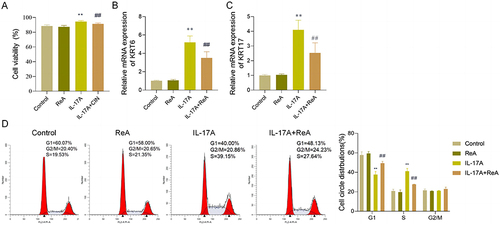
Figure 5 ReA attenuates IL-17A-induced pro-inflammatory cytokine release and up-regulation of chemokine expression in HaCaT cells. (A–C) ELISA to detect the levels of IL-6, IL-8 and IL-1β in the culture supernatant of HaCaT cells in Control group, ReA group, IL-17A group and IL-17A+ReA group. (D–F) RT-qPCR to detect the expression levels of S100A7, S100A9 and CXCL2 in HaCaT cells in Control group, ReA group, IL-17A group and IL-17A+ReA group. **P < 0.01, vs Control group; ##P < 0.01, vs IL-17A group.
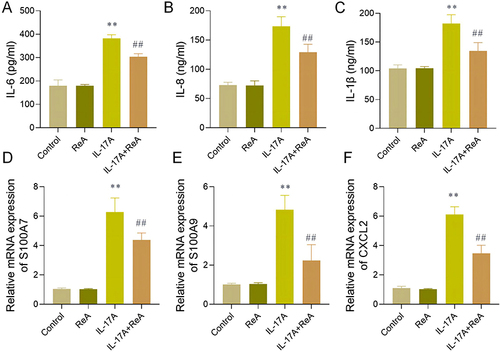
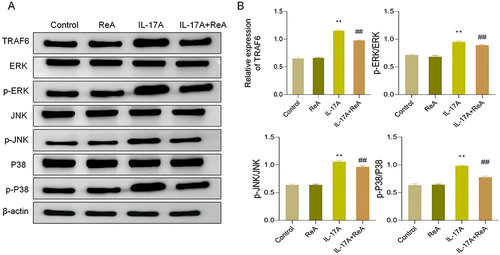
Figure 6 ReA inhibits TRAF6/MAPK signaling pathway activated by IL-17A stimulation in HaCaT cells. (A) Western blot images of TRAF6/MAPK signaling pathway-related proteins. (B) Statistical results of TRAF6/MAPK signaling pathway-related protein levels in cells of Control group, ReA group, IL-17A group, and IL-17A+ReA group. **P < 0.01, vs Control group; ##P < 0.01, vs IL-17A group. Three experiments were repeated.
Data Sharing Statement
The data used to support the findings of this study are available from the corresponding author upon request.