
Figures & data
Table 1 Demographic and Clinical Characteristics of Included Samples
Table 2 Gross Nevi Characteristics of Included Samples
Table 3 Microscopic Characteristics
Table 4 Demographic, Clinical, and Histopathological Characteristics Associated with Nevi Changes
Figure 1 Bar plots illustrating the distribution of the observed nevi changes in the included samples based on (A) Bar charts showing the distribution of nevi changes across patients with positive medical history compared to patients with negative medical history. Positive medical history showed a significantly higher proportion of multiple nevi changes while negative medical history was significantly associated with no nevi changes. (B) Bar charts showing the distribution of nevi changes and number of nevi, patients with multiple nevi changes had a significantly higher number of nevi >10, while patients with no nevi changes had less than three nevi.
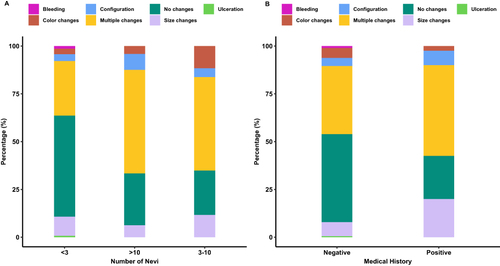
Table 5 Demographic, Clinical, and Histopathological Characteristics Associated with Patients with Positive versus Negative Medical History