Figures & data
Figure 1 Clinical standardized photographic scale of pigmentation of malar area.
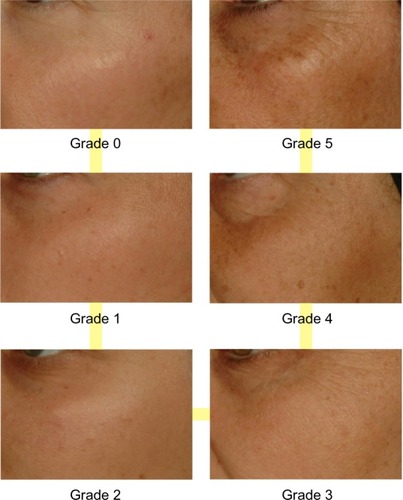
Figure 2 Clinical standardized photographic scale of cheek folds.
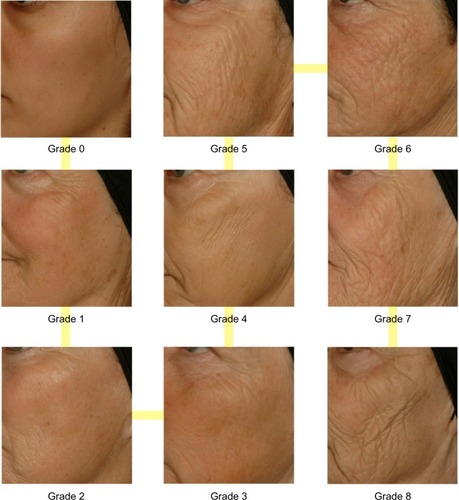
Table 1 Clinical signs used by dermatologists to establish heliodermal status
Table 2 Clinical aging signs of the face, described by atlases, and correlations with age and heliodermal status
Table 3 Wrinkles/texture signs and correlations with age and heliodermal status
Table 5 Microvascular disorders and correlations with age and heliodermal status
Table 4 Pigmentation disorders and correlations with age and heliodermal status
Figure 3 Heliodermal status grade (mean ± confidence interval) in each age cluster. All bars are significantly different from the other, with an exception being the comparison marked on the graph. The number of people in each cluster is indicated between the brackets.
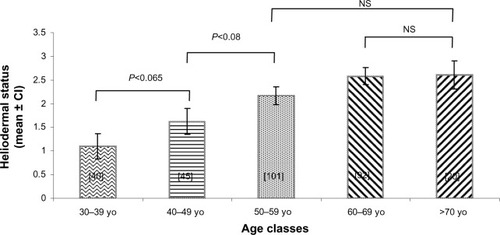
Table 6 Correlations between clinical aging signs and age and heliodermal signs
Figure 4 Comparison of wrinkles and relief texture. Mean scores (± CI 95%) for each age cluster between S-S and S-P.
Abbreviations: S-P, sun-phobic; S-S, sun-seeking; CI, confidence interval.
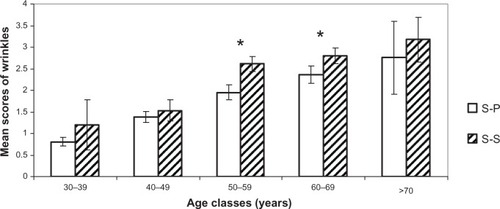
Figure 5 Comparison of ptosis and sagging. Mean scores (± CI 95%) for each age cluster between S-S and S-P.
Abbreviations: S-P, sun-phobic; S-S, sun-seeking; CI, confidence interval.
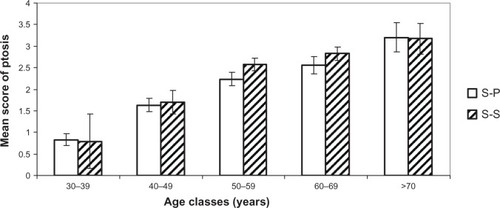
Figure 6 Comparison of pigmentation disorders. Mean scores (± CI 95%) for each age cluster between S-S and S-P.
Abbreviations: S-P, sun-phobic; S-S, sun-seeking; CI, confidence interval.
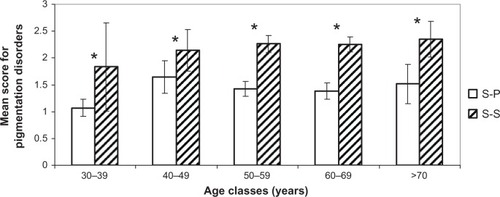
Figure 7 Comparison of microvascular disorders. Mean scores (± CI 95%) for each age cluster between S-S and S-P.
Abbreviations: S-P, sun-phobic; S-S, sun-seeking; CI, confidence interval.
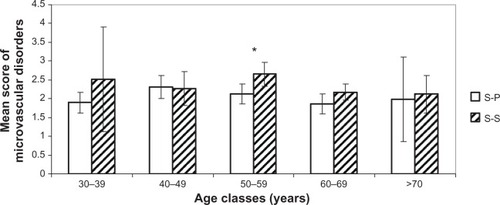
Figure 8 Difference between apparent and chronological age for the S-S and S-P groups.
Abbreviations: S-P, sun-phobic; S-S, sun-seeking; SEM, standard error of the mean.
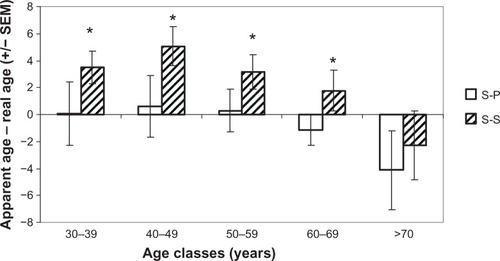
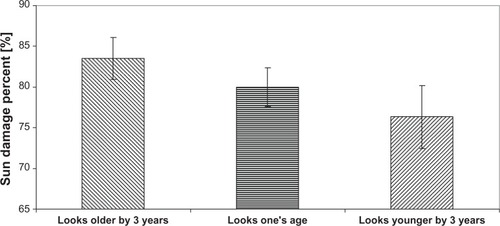
Figure 9 Percentage of sun damage is predictive of how old a woman looks.