Figures & data
Table 1 Basic Information on the Participants in Each Group
Figure 1 Comparison of physiological parameters in three groups. (A) Hydration; (B) TEWL; (C) pH; (D) Sebum; (E) Melanin; (F) Haemoglobin; (G) R2; (H) F4. Significant differences in the Figures are shown by *p < 0.05, ** p < 0.01, and ***p < 0.001.
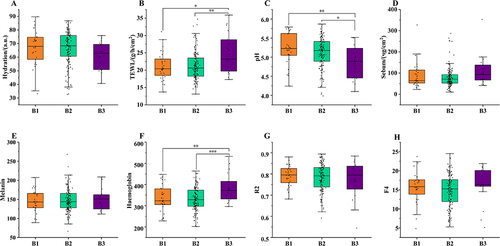
Figure 2 Bacterial diversity in three groups. (A) Shannon index; (B) Chao index; (C) Sobs index; (D) Ace index; (E) Simpson index; (F) Coverage index. Significant differences in the Figures are shown by *p < 0.05, and **p < 0.01.
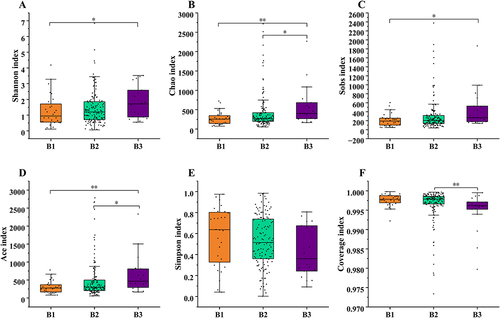
Figure 3 Fungal diversity in three groups. (A) Shannon index; (B) Chao index; (C) Sobs index; (D) Ace index; (E) Simpson index; (F) Coverage index.
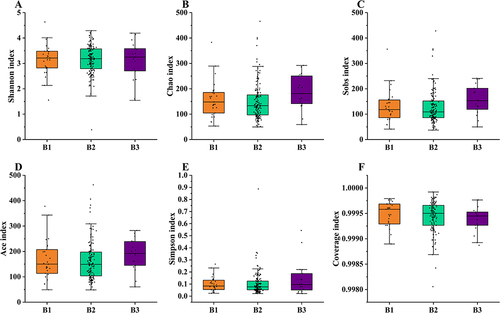
Figure 4 Differences in the relative abundances of skin bacteria and fungi at the phylum level in three groups. (A) Bacterial abundance; (B) Fungal abundance.
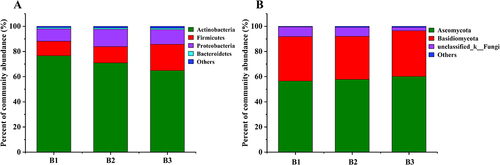
Figure 5 Differences in the relative abundance of the skin microbiota at the genus level in three groups. (A) Bacterial abundance; (B) Streptococcus; (C) Corynebacterium; (D) Fungal abundance; (E) Malassezia; (F) Candida. Significant differences in the Figures are shown by *p < 0.05, **p < 0.01, and ***p < 0.001. Differentially abundant genera and species between the B2 and B3 skin microbiomes, as identified using linear discriminant analysis effect size. (G) Bacteria with statistical significance cut-offs set at LDA > 2.5 and p < 0.05. (H) Fungi with statistical significance cut-offs set at LDA >3.5 and p < 0.05.
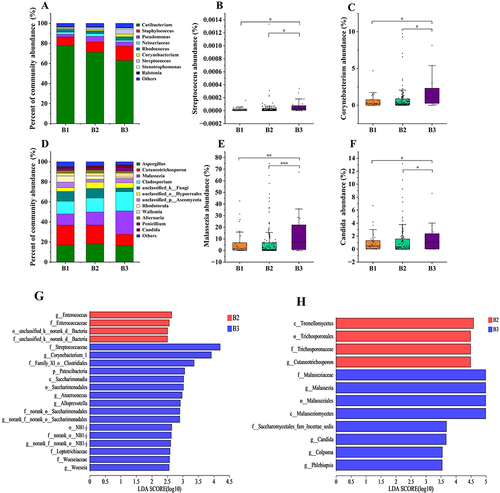
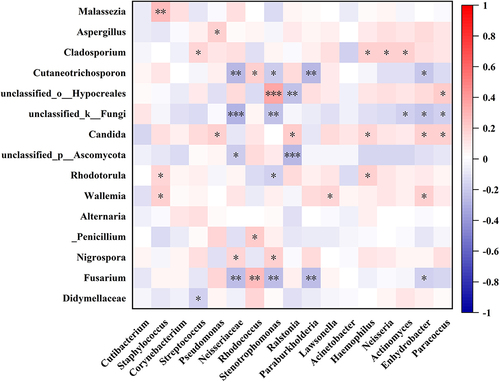
Figure 6 Spearman correlation analysis of facial bacterial, fungal abundance, and skin physiological parameters. *p < 0.05, **p < 0.01, ***p < 0.001.
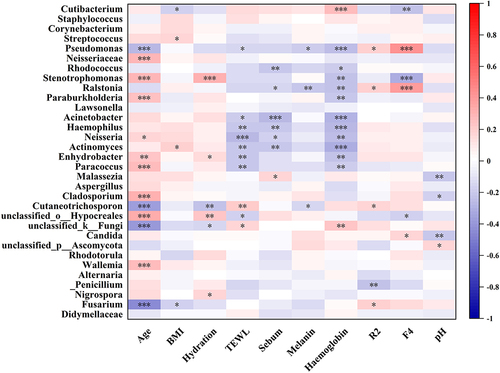
Figure 7 Spearman correlations between facial bacterial and fungal abundance. *p < 0.05, **p < 0.01, ***p < 0.001.