Figures & data
Table 1 Demographic Characteristics and Basics
Table 2 Qualitative Results of Positive Total IgE and Positive Specific IgE Levels Among Different Age Groups, n (%)
Table 3 Qualitative Results of Positive Total IgE and Positive Specific IgE Levels for Different Pruritus Degrees Among Different Age Groups, n (%)
Table 4 Qualitative Results of Positive Total IgE and Positive Specific IgE Levels for Different Lesion Severities Among Different Age Groups, n(%)
Figure 1 Quantitative levels of total IgE for different pruritus degrees among different age groups (excluding 20 patients with IgE >1000 IU/mL).
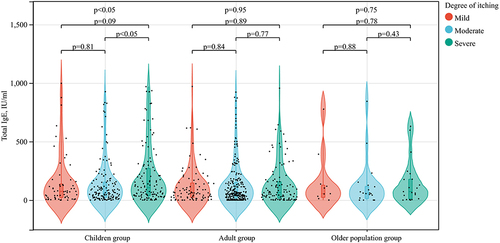
Figure 2 Quantitative levels of total IgE for different lesion severities among different age groups (excluding 20 patients with IgE >1000 IU/mL).
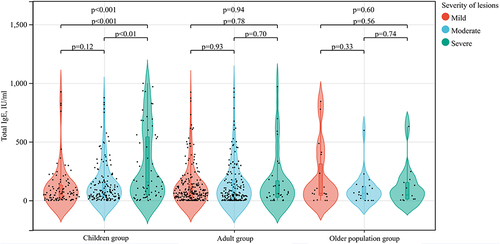
Figure 3 Heatmap of quantitative levels of specific IgE for different pruritus degrees among different age groups. A=Dermatophagoides pteronyssinus, B=Dermatophagoides farinae, C=salix babylonica, D=milk, E=cod, F=wheat, G=peanut, H=soya bean, I=crab, J=shrimp, K=egg, L=beef, M=dander of dog, N=cockroach, O=ambrosia artemisiifolia, P=Artemisia argyi, Q=mutton, R=dander of cat, S=house dust, T=alte.
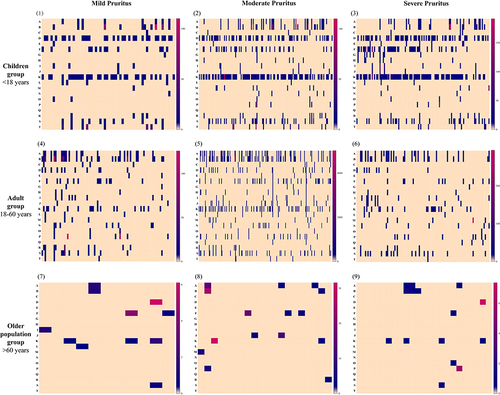
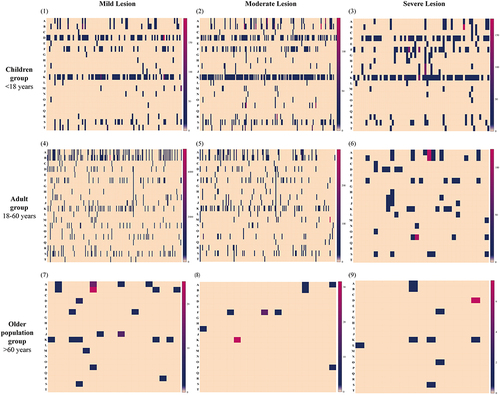
Figure 4 Heatmap of quantitative levels of specific IgE for different lesion severities among different age groups. A=Dermatophagoides pteronyssinus, B=Dermatophagoides farinae, C=salix babylonica, D=milk, E=cod, F=wheat, G=peanut, H=soya bean, I=crab, J=shrimp, K=egg, L=beef, M=dander of dog, N=cockroach, O=ambrosia artemisiifolia, P=Artemisia argyi, Q=mutton, R=dander of cat, S=house dust, T=Alternaria.