Figures & data
Figure 1 Differential analysis of GSE13355. (A) The heatmap of the top 50 DEGs associated with psoriasis in the GSE13355 dataset. (B) The volcano plot of differential analysis.
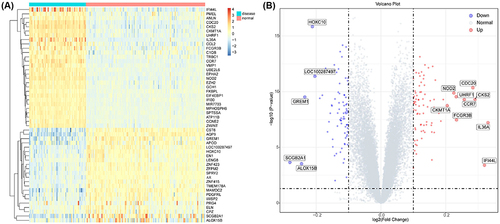
Figure 2 The expression of ferroptosis-related genes in GSE13355. (A) The overlap genes of psoriatic-related DEGs and ferroptosis-related genes. (B) Ferroptosis-related DEGs in GSE13355.
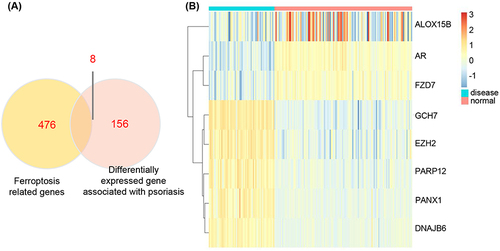
Figure 3 Pathway enrichment of differentially expressed genes. (A) The enrichment GO pathways of psoriasis-related DEGs. (B) The enrichment GO pathways of ferroptosis-related DEGs. (C) The enrichment reaction pathways of ferroptosis-related DEGs.
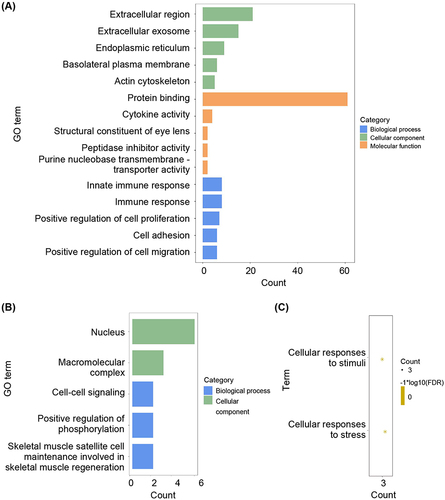
Figure 4 Protein regulatory network of differentially expressed genes. (A) PPI network of differentially expressed genes. (B) The degree of top genes in the PPI network.
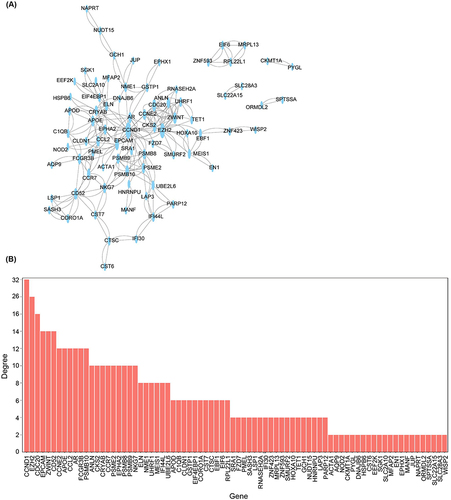
Figure 5 Hub genes of the PPI network identified by Cytoscape. (A) Top 10 hub genes identified by EPC algorithm in Cytoscape. (B) Top 10 hub genes identified by degree algorithm in Cytoscape. (C) Top 10 hub genes identified by Closeness algorithm in Cytoscape. (D) Top 10 hub genes identified by BottleNeck algorithm in Cytoscape.
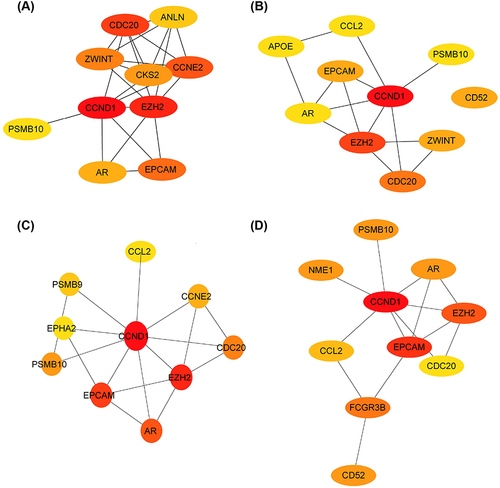
Figure 6 Model performance of candidate marker genes. (A) The ROC curve of the LightGBM model in 10-fold cross-validation. (B) The ROC curve of the LightGBM model in test datasets.
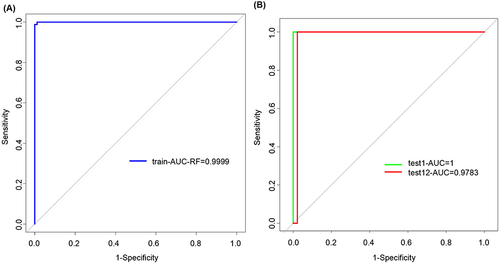
Figure 7 Drug Targeting of hub genes in DGIdb database.
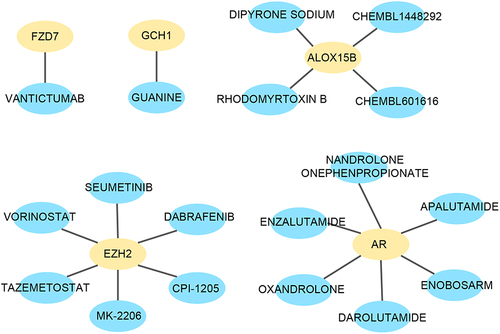
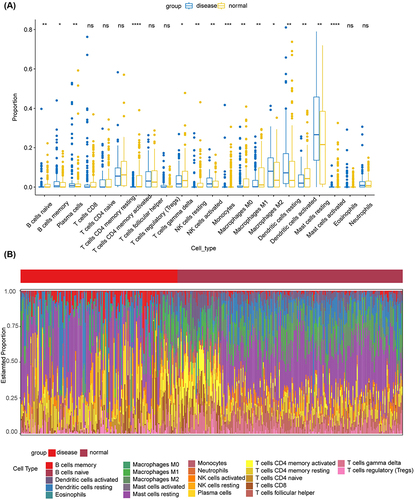
Figure 8 Immune infiltration of samples. (A) The difference between immune cells in healthy samples and psoriasis samples. (B) Estimated proportion of immune cells in healthy samples and psoriasis samples. * p < 0.05, ** p < 0.01, *** p < 0.001, **** p < 0.0001.